气候变化的哨兵-冰川

glaciers - glaciers montagne - encyclopedie environnement - mountain glaciers

       作为山地的真正标志,冰川是检测气候变化的主要工具。然而,冰川和气候之间的相互作用是复杂的,有时是间接的,而且在世界不同地区有很大的差异。冰川表面质量平衡(每年表面质量的增减)的测量或估计是了解过去一个世纪或几十年和当前波动的一个重要变量。这些测量结果为我们提供了过去 30 年来监测的非常高的冰川质量损失的信息。在模型的支持下,可以预测冰川的未来及相关影响,例如冰川起源的危害,湖泊或冰川瀑布。

  大部分山地冰川的急剧下降是20世纪气候变化最明显的自然要素之一。因此,冰川的演变现在被认为是气候变化的一个强相关指标。在人迹罕至的区域、山区和极地等缺乏直接气象数据的情况下,冰川监测为我们提供了关于气候波动的直接信息。冰川的演变也产生了非常严重的后果:冰川是许多山区流域水文循环的主要组成部分,在科学研究中,它们对上世纪和未来海平面上升的贡献也占有重要地位。更不用说可能发生在地球不同地区的冰川/水文-冰川灾害了。

  因此,有必要对冰川进行长期监测,以正确记录冰川与气候之间的关系,检测当前的气候变化,记录近期的气候变化并预测其演变和相关影响。

  在这篇文章中,我们将主要关注世界上记录最详细的冰川之一:阿尔卑斯山冰川,以准确描述冰川的演变及其相关过程。

1. 通过质量平衡量化冰川和气候之间复杂的相互作用

  虽然景观尺度上冰川的前进或后退是其演变的一个非常直观的证据。事实上,冰川变化与气候波动之间的联系因每个冰川而异。冰川由顶部流向山谷的冰组成,由于每个冰川的几何形状(大小、坡度、高度、盆地形状等)不同,所以不同冰川的流速相差较大。冰川的前缘对气候压力的反应是极端多变的天气。因此要破译每条冰川记录的气候信号,就需要测量和分析整个冰川的质量平衡

1.1. 冰川的质量平衡

  冰川是由积聚消融这两个过程的此消彼长形成的。

  积聚是指主要由于降雪导致的质量增加。在阿尔卑斯山,积雪主要是由于冬季降雪,有利于冰川堆积。在热带地区,部分降雪在夏季形成雨季。然而积雪的重新分布还取决于风、雪崩流等。

  地表消融是指通过融化、升华(雪的蒸发)以及在某些情况下通过冰舌的解体以冰山的形式进入湖泊或海洋(被称为冰川的 “开裂”)而造成的质量损失。消融源于地表能量平衡,即冰川表面能量流的总和,以辐射的形式存在,但也以“敏感”热的形式存在(见焦点)。

  因此,冰川的演变取决于质量增减之间的平衡,其差值就是冰川的质量平衡。因为天气条件随海拔高度与暴露程度而变化,总的质量平衡掩盖了冰川尺度上显著的局部差异。这些评估是在水文年度结束时进行的(在阿尔卑斯山从n年的10月到n+1年的9月底)。

  冰川顶部在夏末(消融季节)仍然被积雪覆盖,其质量增加大于损失,这称为积累区,该区域的质量平衡为正。这就是著名的“永恒之雪”,其延伸范围从一年到下一年是不同的。

  冰川下部的质量损失大于增加,质量平衡为负,称为消融区。在消融季节结束时,冬天的雪消失殆尽,往年的冰崭露头角。
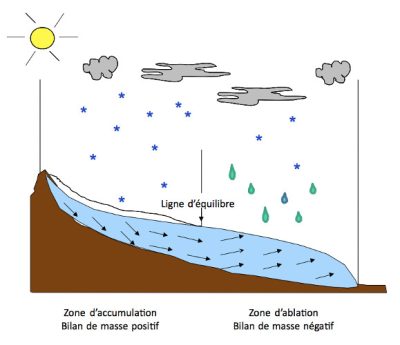
环境百科全书-冰川-冰川示意图
图(1) 冰川示意图
包括上部净积累区、下部净消融区和冰川的平衡线。冰川内部的箭头表示冰从上部流向下部。[© P. Wagnon](ligne dequilibre 平衡线 Zone daccumulation Bilan de masse positif 聚集区,质量平衡为正 Zone dablation Bilan de masse negative 消融区,质量平衡为负)

  在水文年结束时,净积累区和净消融区的边界是冰川的平衡线(图1)。冰块沿斜坡的流动补偿冰川上层和下层之间的质量不平衡,从而达到上下层之间的质量均衡,这被称为冰川的 “动态”。因此,冰川的厚度由于积累、消融和流动之间的平衡而不断变化。

  年度地表质量平衡与当地天气条件(降水、温度、湿度、风、辐射,见焦点)直接相关。因此从气候的角度来看,长期监测世界各地不同冰川的质量平衡参数意义深远。

1.2. 表面质量平衡的测量
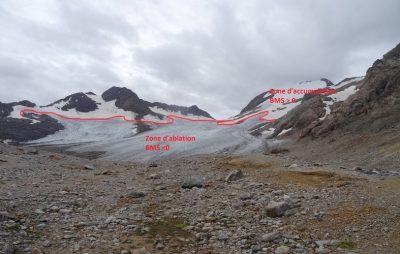
环境百科全书-冰川-圣索林冰川
图(2) 2014 年秋季的圣索林冰川
显示了积累区(雪)和消融区(流动冰川)之间的边界。 [© D. Six](Zone dablation 消融区 Zone daccumulation 堆积区)

  在阿尔卑斯山的冰川上,冬季的积雪是人工测量的,而在春季则使用均匀分布在整个冰川上的表面冰芯进行测量(图3)。冬季沉积的雪量是通过确定前一年的水平来测量的。通过称重获得这些积雪的密度,从而可以将这些雪的高度转换成水的高度。此外,通过使用雪探针简单地测量雪深来增加测量网络的密度。在法国阿尔卑斯山的冰川上,每年有大约40个测量点的数据被记录下来(其中大约10个以冰芯的形式,其余的使用雪探针测量)。
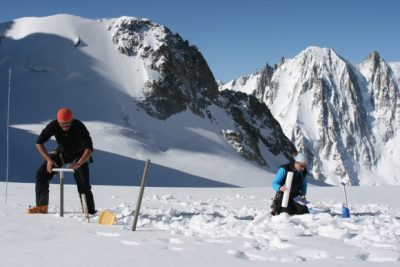
环境百科全书-冰川-深冬取样1
图(3) 在阿尔卑斯山(勃朗峰山地)使用手动取样器进行深冬取样(左)
然后对冰芯进行称重,将雪深转化为水深(右)。[© P. Ginot]

  移除量是通过前几年埋入的木桩或桩子(”标签“)的出现来衡量的(图2)。

  在积累区,信标于春季被植入用于测量堆积的钻孔中。这些标桩将使我们有可能监测这一地区的夏季融雪情况。

  在消融区,在冬季降雪之前的秋季,使用蒸汽探针在几个具有代表性的消融区位置放置10米长的信标。当这些信标在夏季出现时,可以在消融区的每个点测量冰的损失。
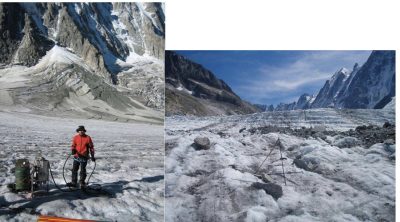
环境百科全书-冰川-深冬取样2
图(4) 在阿尔卑斯山(勃朗峰山地)使用手动取样器进行深冬取样(左)
然后对冰芯进行称重,将雪深转化为水深(右)。[© Ch.Vincent]

  积聚和消融测量用于计算冰川任何一点的质量平衡,用水位来表示(考虑到雪和冰密度的差异)。质量平衡表现为冰川获得或损失的水量。这种全球质量平衡是在水文年测量的。冰川的体积变化除以冰川总表面积,这样能够比较大小冰川(归一化),这就得出了平均水深或体隙(blade),也就是冰川表面积的年质量平衡。例如,如果冰川的质量平衡在1年内是-1米的水,这意味着冰川损失的水量相当于1米的水深分布在整个表面。

1.3. 冰川的质量平衡在不同地区对不同的气象参数敏感程度不同

  冰川对气象变量的敏感性高度取决于区域条件。

  • 在阿尔卑斯山,消融与大气温度密切相关。
  • 靠近海洋的所谓“海上”冰川(如斯堪的纳维亚半岛)对降水的变化非常敏感。
  • 世界上的一些地区,如喜马拉雅山脉西部的帕米尔,受到季风的严重影响,季风提供了大部分的降雨。
  • 在非常干燥的地区,如安第斯山脉,升华作用(从物体的固相直接转化为气相)在消融中起着重要作用,并强烈影响着能量平衡,因为它消耗了大量的能量(而留给融化消耗的能量较少,参见焦点)。
  • 位于高山(和极地)的所谓“”冰川,温度非常低(通常低于-10ºC),在开始融化前必须升温到0°C。因此,它们的质量平衡对气候变暖的敏感性要小得多。

  极地冰盖的功能各异。融化能够完全以清除积聚在上部的冰块,冰川沉入海中,最终通过冰山的“崩塌”失去质量,南极冰盖的许多冰川就是这种情况。这些冰川的质量平衡对水流条件非常敏感(特别是在冰川的底部),而对表面融化过程的敏感程度要低得多。

  因此,冰川对气候变化的响应在世界不同地区并不相同。

1.4. 冰川通过其质量平衡来适应气候

  很多情况下,在对气候相应中,通过改变其几何形状(表面、长度和厚度)冰川流动起着重要作用。然而这种几何形状本身影响着总的质量平衡。事实上,如果气候变暖,冰川表面融化将增加,其质量平衡将减少,并且随着反应时间的推移,其前端将后退,冰川表面也因此在下部减少。由于这种表面积的减少位于消融区,冰川的总融化量将减少,其总质量平衡趋于零。因此,冰川的表面会根据气候条件进行调整,以达到平衡的状态。由于气候条件一直不稳定,这样的平衡只是理想状态下存在。

  因此随着整个冰川的质量平衡的调整,几何参数并不是气候条件的最佳指标。与气候条件直接相关的是冰川上每个点的表面质量平衡,即在冰川的每个点上测量的积累和消融的总和(见焦点)。

2. 自末次冰期结束以来,高山冰川的波动情况(全新世)

  在末次冰期期间,阿尔卑斯山的冰川占据了所有的主要山谷,并延伸到里昂平原。在最后一次冰川运动的高峰期过后,大约2万年前,冰川开始了非常强烈的退缩,导致它们变成了现在的构造,在这个被称为全新世的冰期,涵盖了过去大约1万年的时间。关于过去一万年的冰川波动,我们了解多少呢?

2.1. 全新世初期的碎片化和间接知识

  在几千年的时间范围内,我们只能根据冰川冰碛(冰川在其消融区留下的各种大小岩石的堆积)的位置,泥炭地的花粉,以及对树木年轮的研究(树木气候学)间接地观察到冰川的连续进退。在距今7500和6500年前的全新世时期,高山冰川急剧下降,这很可能是过去一万年中最温暖的时期,那时的冰冻灾害比今天要少。

  在距今2500-1900年前(罗马时代),冰川已经急剧下降,它们和现在一样小,甚至更小。但是全新世的后期也有几个寒冷的事件,包括14世纪到19世纪中期发生在阿尔卑斯山的“小冰河期”。
环境百科全书-冰川-罗纳冰川
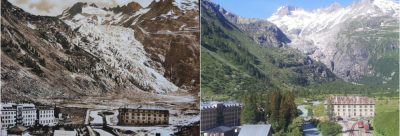
图(5) 罗纳冰川(瑞士)在20世纪初(作者不详)和2016年的情况。[© Ch. Vincent]

  小冰河期阿尔卑斯山冰川的波动有相当多的记录,主要是通过古代故事和雕刻品。在这一时期,瑞士的阿莱奇冰川范围在1350年左右达到最大,然后在1580-1650年和1820-1850年期间再次达到最大。这期间的冰川比现在长3至3.5公里。

  法国的海冰在1590至1680年和1820至1850年之间延伸显著,当时它的长度比2017年的长度长了近2.5公里,这些冰川随后在地貌上留下了冰碛沉积物,这是这一时期典型特征(图5)。

2.2. 小冰河期结束以来冰川的演变

  自 19 世纪中叶以来,更多的定量观测使得我们能够更加详细地描述冰川的演变。特别是可以进行大量冰川长度(冰川前缘位置)的测量。由于旧的地形图和现有的实地调查,冰川变化告诉我们20世纪和21世纪气候特征截然不同。

  不可否认,自1850年和小冰河期结束以来,阿尔卑斯山的绝大多数冰川都在减少,据估计冰川表面和冰川体积平均减少了一半左右。但平均值掩盖了显著的异质性,因为一些山丘损失了近60%的表面积(瓦努瓦斯和埃克林山丘),小冰川完全消失,其他冰川则支离破碎,而一些山丘只损失了20%至30%的表面积(勃朗峰山丘)。
环境百科全书-冰川-勃朗峰山地的冰川前部的退缩
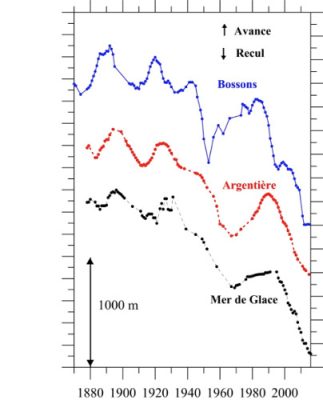
图(6) 自19世纪末以来,勃朗峰山地的三条大冰川前部的退缩(以米为单位)
纵轴代表每条冰川随时间推移所损失的长度。可以区分出20世纪60年代至80年代的最后一次小的冰川洪水(锋面的重新推进)和过去30年剧烈的下降,并注意到冰川前缘反应时间的变化,波松冰川对地表质量平衡的变化几乎有一个瞬间的反应。[来源:Vallot,水和森林服务,GLACIOCLIM观察站]
(Avance 上升;Recul 下降;Bossons 波松;Argentirer 阿根蒂;Mer de Glace 冰海)

  在此期间并不是持续下降。阿尔卑斯山冰川在过去的170年中经历了一些小的冰川洪水,特别是在20世纪60-80年代中期的最后一次冰川推进期间(图6)。

  最后,在过去的30年里,冰川已经急剧减少。布朗峰山地的冰川和阿根蒂埃尔冰川已经后退了约750米,博桑斯冰川已经后退了1公里多。冰舌也变得相当薄了。自1990年以来,冰川的下部已经失去了近100米的厚度(典型的是在蒙特尼维尔火车到达站的地方)。

  这些在景观中可察觉的几何变化(缩短和变薄)是冰川表面质量平衡变化的结果,响应时间从几年到几十年不等。因此,过去30年观察到的冰川的剧烈变化与自20世纪80年代中期以来质量平衡远小于零有关。

2.3. 过去30年来冰川质量的巨大损失

  如上所述,冰川表面质量平衡比其长度更准确地代表了冰川对气候的响应。但质量平衡的测量是最近的(自20世纪50年代在法国开始),覆盖的冰川较少。世界上仅有大约三十个连续系列的质量平衡系列超过30年。

  阿尔卑斯山国家(法国、瑞士、意大利、奥地利)有测量质量平衡的悠久传统。因此根据这些观测,最近的一项研究表明,1980-2010年期间,所有瑞士冰川的平均质量平衡为每年-0.62米(相当于其整个表面的平均水损失)。阿尔卑斯山的法国、奥地利和意大利的山脉情况相似。例如,1983-2016年间,冰海冰川和阿根蒂尔冰川的质量平衡分别为每年-0.90和-0.80米。自2003年以来,质量损失加速,阿尔卑斯山冰川的质量平衡损失更加严重,冰海冰川和阿根蒂尔冰川的质量平衡分别为每年-1.70和-1.40米。

  在整个阿尔卑斯山脉400公里的范围内,每年的质量平衡波动是非常相似的。最近的一项研究显示了这一点,该研究比较了奥地利和法国之间阿尔卑斯山脉上6个大型冰川在过去50年里的质量平衡演变。

  如1.3部分所述,冰川的总质量平衡不仅取决于气候条件,还取决于其表面的演变及其不平衡性。比较典型的情况是在2001-2016年同期,阿根蒂尔冰川(勃朗峰地块,19平方公里)和小圣索林冰川(大鲁斯山地块,3平方公里)每年分别流失1.30米和 2.00米的水。如果将年度质量平衡随着时间的推移相加,这些平衡差异就更加显着。因此在 2001-2016 期间,阿根蒂尔冰川的累积质量平衡为-20米的水,圣索林的累积质量平衡为-30米的水。

  为了克服每个冰川特有的气候敏感性,研究站点冰川质量平衡的演变(在冰川的每个点)比研究冰川的整体质量平衡更有意义。1962-1983年冰川处于近平衡状态(在此期间几乎没有厚度变化),站点质量平衡显示,在接下来的1983-2002年期间,融化量每年增加0.85米的水,在最后的2003-2013年期间每年增加1.63米的水。

  质量平衡为负是由于夏季变暖和消融季节延长2至3周,而近几十年来高海拔地区的雪量变化很小。

3. 超高海拔冰川:对气候变化的特殊反应

  在阿尔卑斯山,几乎所有的山谷冰川都是所谓的温带冰川,也就是说冰川的温度接近冰的熔点。在阿尔卑斯山大约3500 m以上,冰被说成是“冷的”,即在非常低的温度下(位于4,300m的Dôme du Gouter冰川底部大约为-11℃,位于勃朗峰上的通道以及覆盖勃朗峰顶峰的小冰盖底部为-17℃)。冰川的温度取决于许多因素,包括海拔高度、暴露程度、地表积雪和冰川流量。尤其是当冰川在很高海拔处有一个堆积盆地时,例如波松冰川或Taconnaz冰川(勃朗峰地块),在高海拔处形成的冷冰在向下流动时会缓慢升温,并使冰川保持在“冷”状态,直到海拔远低于3500 m。

  对这些高海拔寒冷地区的监测表明两个特点:一方面,冰的厚度在过去一个世纪里变化相对较小。另一方面冰川内部温度变化很大。

  因此,Dôme du Gouter冰川(4,300米)的厚度在过去30年中只变化了几米。一项研究表明,自20世纪初Joseph Vallot和他的表兄弟在勃朗峰山地进行精确的地形测量以来,这个冰川(覆盖勃朗峰山顶的冰川)的厚度一直没有变化,不确定度为几米。然而这些保存在极高海拔地区的冰川丘陵只代表阿尔卑斯山的小部分地区。
环境百科全书-冰川-冰川的垂直温度分布
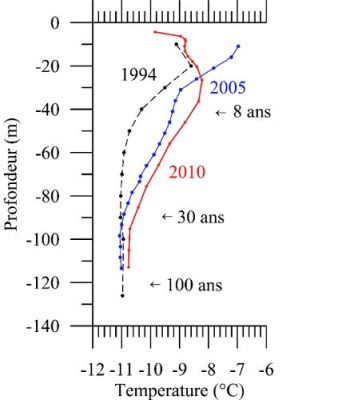
图(7) 在Dôme du Gouter冰川(4300 m,勃朗峰地块)的钻孔中测量的垂直温度分布
冰川的深度为 135 m,并且已经测量了从表面(深度 0 m)到岩床的温度。1994年至2010年之间温度上升。年龄对应于冰的年龄。[来源:改编自Gilbert和Vincent,[1]]
(Profondeur 深度;Temperature 温度)

  尽管地表没有明显变化,但高海拔的冰川却受到大气变暖的影响,其内部温度升高。在这些高海拔冰川虽然没有气象站,但测得的温度曲线为该海拔高度的气候变化提供显著指标三这些措施仍然很少见。自 1994 年以来,在 Col du Dôme(4300 m,勃朗峰地块)从地表到135 m深度的冰芯钻孔中测量了温度,岩床附近的冰温度为-11℃。观测结果表明,在20年内(1994、2005 和2010进行测量),冰层在50 m深度迅速升温至1.5℃以上(图 7)[1]。实际上冰是过去的档案,因为温度的任何变化都会逐渐渗透到冰层中。因此垂直温度曲线使我们有可能重建近一个世纪以来大气温度的演变。重建得到的结论是高海拔地区的变暖与在平原地区非常相似

4. 冰川变化的影响

  气候变暖和消融加剧会对冰川产生不利影响。因此,寒冷的高海拔冰川变暖将改变所谓的“悬浮”冰川稳定性,这些冰川位于非常陡峭的斜坡上,其稳定性归因于其基础温度为远低于零度(阻止了水循环与岩床接触)。当冰川底部的温度达到熔点时,这些冰川就会变得不稳定(冰川与岩床的摩擦力将大大降低)。这种情况经常发生在Taconnaz冰川(勃朗峰地块)[2]的上部区域。

  冰川变化的另一个危害与湖泊有关,这些湖泊形成于冰川退缩留下的洼地,并由冰碛坝封闭,有时是不稳定的(冰川湖)。当这些湖泊没有出口或出口不足时,就会有突然排空的风险。这对山谷中的居民构成威胁。尼泊尔的许多冰川都被冰碛碎石覆盖,并在退却后留下了壮观的正面冰碛,被称为 “冰河”。

  最后,在冰川中可以形成一些水(冰内湖),它是由与气候间接相关的复杂过程形成的。这些现象是罕见的,但是非常致命。1892年勃朗峰山地的Tête Rousse冰川内湖突然排空,造成圣热尔韦175人死亡。2010年,一个冰内湖重新形成并被及时发现:如果它破裂,可能会造成3000人死亡[3]

5. 全球冰川退缩

  20世纪国际上为更好地记录冰川的演变做出了努力。然而在全世界记录的25万个冰川中,只有大约30个有超过30年的质量平衡测量记录。因此冰川数据仍然非常少。航空照片和卫星图像可以部分地填补这些空白,通过多角度观测,准确地重建冰川的地形(这被称为摄影测量学),但该项技术始于20世纪50年代,并不包括所有的冰川地貌。卫星图像现在是预测冰川厚度变化的重要数据来源。但是这项技术从20世纪80年代初期才开始应用,2000年以后才普遍应用,如果要分析长时间序列还为时尚早。使用气象数据重建,以分析冰川对气候变量的敏感性,可以完善这套观测序列。

  世界各地现有的所有观测和重建显示,山地冰川在小冰河期结束后普遍消退,大部分是在19世纪中期左右,尽管对一些山丘来说,早在18世纪中期就开始消退了。区域差异显著可能与气候变化的区域差异有关,但也与世界各地冰川的不同敏感性有关(1.3节)。例如,挪威海岸附近或新西兰西海岸附近的“海上冰川”对降水变化特别敏感。在喜马拉雅山脉,尼泊尔的冰川似乎对来自东南亚的季风非常敏感。安第斯山脉的热带冰川(玻利维亚、秘鲁)对厄尔尼诺现象非常敏感等。

  除了少数罕见的情况,冰川目前正处于普遍消退。与阿尔卑斯山一样,阿拉斯加、热带安第斯山脉和巴塔哥尼亚的冰川正在遭受很大的质量损失。阿拉斯加的冰川在过去10年中每年损失约0.6米的冰层,而加拿大的北极冰川则损失了0.3至0.7米的冰层。热带安第斯冰川(特别是玻利维亚、秘鲁)40年来年平均损失60厘米至1米的冰层。非洲的冰川很快就会消失:乞力马扎罗山顶的冰川表面在1912年至2012年间从11.4km²缩减至1.8 km²,而在未来几十年内可能完全消失。

  喜马拉雅冰川遭受的损失相对较小,在整个喜马拉雅山弧上平均每年冰层减少约 20 厘米。但这个地区通过卫星获得的精确数据不超过20年[4]。平均值掩盖了巨大的空间异质性:在喜马拉雅山脉以东(尼泊尔、不丹),2000-2016 年期间质量平衡在每年 -0.4到-0.7 m之间,而在山脉以西(帕米尔),质量平衡为负(每年约-0.1 m)。昆仑山脉(喀喇昆仑山以北)2000-2016年期间的质量平衡甚至略微为正(+0.15 m/年),这种情况很可能是由于降雨量增加。

  关于全世界范围内冰川的演变概况,可以参考Francou和Vincent的书(2015)[5]。此外,世界冰川监测服务网站(http://wgms.ch)上也提供了世界各地观测到的冰川的详细数据。

6. 冰川的未来:未来几十年将大幅下降

  由于对世界不同地区的冰川进行了长时间序列测量,现在已经可以模拟冰川的演变以重建其历史或确定其未来的演变,这些都是预测山区水资源或冰川对海平面影响的主要问题。

  这些对未来的模拟基于气候背景,可以预测至21世纪末(有些甚至更久)温度和降水等参数的不同轨迹。但降水变化具有极大的不确定性,也会影响冰川变化的预测。从这些气候情景中,我们很好地了解了气候控制质量平衡,从而能够预测每个冰川的质量平衡,结合模拟冰川流动的动态模型来预测冰川未来的退缩和体积损失。

  所有的模拟均表明,无论未来 20 年的气候情景如何,阿尔卑斯山的冰川在未来几十年都将急剧下降。事实上,冰川与目前的条件相比处于极不平衡的状态,其表面积与过去 30 年的气候条件相比太大了。即使气候条件在接下来的几十年里保持不变,冰川的表面积在恢复到稳定状态之前也会大幅减少。例如,在过去 20 年的平均气候条件下,阿尔卑斯山最大的冰川阿莱奇在恢复稳定状态之前会损失40%的体积。

  然而,高精度建模需要所研究冰川的非常精确的信息(冰层厚度、基岩地形),这严重限制了对世界上少数冰川的研究。到 2100 年,在+2℃的相对乐观的情况下,阿莱奇冰川(现在长22公里)的前部预计将后退10公里,并可能失去90%的体积。

  据估计,在阿尔卑斯山范围内,到 21 世纪末,现有冰川表面的 80% 至 95% 可能会消失,具体取决于所遵循的气候方案。这将影响欧洲部分地区的水资源(参见:“气候变化对积雪、高山冰川以及水资源的影响”)。
环境百科全书-冰川-气候情景
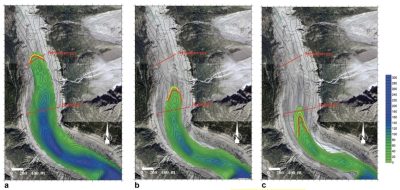
图(8) 基于简单的冰川动力学模型和几种气候情景:无温度变化(绿色轮廓)、+0.02℃/年(黄线)和+0.04℃/年(红线),模拟2020年(a)、2030年(b)和2040年(c)的冰舌的收缩和厚度损失(颜色)。

  在阿尔卑斯山,海拔3500米以上没有积累区的冰川可能在2100年之前全部消失。尽管积累区的冰舌急剧缩短,但超过 4000 米的冰川远未消失。例如,预计未来30年冰海前沿将下降1至1.2公里(取决于所考虑的气候情景)(图 8)[6]


参考资料及说明

封面图片:Public domain.

[1] Gilbert, A., C. Vincent, 2013. Atmospheric temperature changes over the 20th century at very high elevations in the European Alps from englacial temperatures, Geophysical Research Letters, 40, 2102-2108 DOI : http://dx.doi.org/10.1002/grl.50401

[2] Gilbert, A., C. Vincent, O. Gagliardini, J. Krug and E. Berthier (2015). Assessment of thermal change in cold avalanching glaciers in relation to climate warming, Geophys. Lett. Res. Lett., 42, doi:10.1002/ 2015GL064838. DOI: http://dx.doi.org/10.1002/2015GL064838

[3] Vincent, C., Garambois, S., Thibert, E., Lefebvre, E., Le Meur, E., Six, D. Origin of the outburst flood from Glacier de Tête Rousse in 1892 (Mont Blanc area, France). Journal of Glaciology, 56, 688-698. 2010. DOI: https://doi.org/10.3189/002214310793146188

[4] Brown F., E. Berthier, P. Wagnon, A. Kääb and D. Treichler. 2017. A spatially resolved estimate of High Mountain Asia glacier mass balances from 2000 to 2016. Nature Geoscience. 7 August 2017, DOI: 10.1038/NGEO2999

[5] Francou B. and C. Vincent. What’s new on the white planet. 2015. Editions Glénat. 143 p. EAN/ISBN : 9782344008157. Publisher link: http://nature.glenatlivres.com/livre/quoi-de-neuf-sur-la-planete-blanche-9782344008157.htm)

[6] Vincent, C., M. Harter, A. Gilbert, E. Berthier and D. Six. 2014. Future fluctuations of Mer de Glace, French Alps, assessed using a parameterised model calibrated with past thickness changes. Ann. Glaciol, 55(66), 15-24. doi: 10.3189/2014AoG66A050


环境百科全书由环境和能源百科全书协会出版 (www.a3e.fr),该协会与格勒诺布尔阿尔卑斯大学和格勒诺布尔INP有合同关系,并由法国科学院赞助。

引用这篇文章: SIX Delphine, VINCENT Christian (2024年3月14日), 气候变化的哨兵-冰川, 环境百科全书,咨询于 2024年12月25日 [在线ISSN 2555-0950]网址: https://www.encyclopedie-environnement.org/zh/climat-zh/mountain-glaciers-sentinels-of-climate-change/.

环境百科全书中的文章是根据知识共享BY-NC-SA许可条款提供的,该许可授权复制的条件是:引用来源,不作商业使用,共享相同的初始条件,并且在每次重复使用或分发时复制知识共享BY-NC-SA许可声明。

Mountain glaciers, sentinels of climate change

glaciers - glaciers montagne - encyclopedie environnement - mountain glaciers

As true icons of mountain regions, glaciers are major tools for detecting climate change. However, the interactions between glaciers and climate are complex, sometimes indirect and highly variable from one region of the world to another. The measurement or estimation of glacier surface mass balance (the gain or loss of surface mass each year) is an important variable to understand past and current fluctuations over the past century or decades. These observations provide us with information on the very high mass losses observed over the past 30 years. With the help of models, it is possible to estimate the future of these glaciers and therefore some associated impacts, such as hazards of glacial origin, such as lakes or seracs falls.

The sharp decline of most mountain glaciers is one of the most obvious and visible natural elements of climate change during the twentieth century. As such, glacier evolution is now recognized as a very relevant indicator of climate change. In inaccessible regions, in mountains and in polar regions, where direct meteorological data are lacking, glacier monitoring provides us with direct information on climate fluctuations. The evolution of glaciers also has very important consequences: glaciers are a major component of the hydrological cycle in many mountain catchments. Their contribution to sea-level rise over the last century and the next century also occupies an important place in the work of the scientific community. Not to mention all the glacial or hydro-glacial hazards that may occur in different parts of the planet.

Therefore, long-term monitoring of glaciers is necessary to properly document the relationship between glaciers and climate, to detect current climate change, to document recent climate change and to predict its evolution and associated impacts.

In this article, we will focus mainly on the Alps’ glaciers, among the best documented in the world, to describe precisely the evolution of these glaciers and the processes involved.

1. Glaciers and climate, complex interactions quantified by mass balance

While the advance or retreat of glaciers in the landscape is a highly visual testimony to their evolution, the fact remains that the link between these fluctuations and climate fluctuations is specific to each glacier. Glaciers are made up of ice that flows from the upper parts to the valleys: due to the geometry of each (size, slope, altitude, shape of the basin, etc.), the flow velocity is very different from one glacier to another. The fronts of glaciers thus respond with extremely variable weather to the stresses of the climate. To decipher the climate signal recorded by each glacier, it is therefore necessary to measure and analyze the mass balance of the entire glacier.

1.1. The mass balance of a glacier

Glaciers result from the competition of two processes, called accumulation and ablation.

Accumulation is the mass gain mainly due to snowfall. In the Alps, accumulation is mainly due to winter snowfall. A winter with heavy snowfall will benefit glaciers. In tropical regions, some of the snow falls in summer, which is the wet season. However, at the local level, snow accumulation also depends on the redistribution of snow by wind, avalanche flows, etc.

Surface ablation is the loss of mass by melting, sublimation (evaporation of snow), and in some cases by disintegration of the glacier tongue into a lake or sea in the form of icebergs (referred to as “calving” of the glacier). Ablation results from the surface energy balance, i.e. the sum of the energy flows on the surface of the glacier, in the form of radiation but also as “sensitive” heat (see focus).

The evolution of a glacier thus depends on the balance between these two terms of gain and loss of mass, the difference being the mass balance of the glacier. The total mass balance hides significant local disparities at the glacier scale, because weather conditions vary according to altitude but also exposure. These assessments are carried out at the end of the hydrological year (which runs in the Alps from October of year n to the end of September of year n+1).

In the upper part of the glacier, the mass gain is greater than the loss: this is the accumulation area, still covered with snow at the end of the summer (the ablation season). The mass balance is positive in this area. This is the domain of the famous “eternal snows”, whose extension varies from one year to the next.

In the lower region of the glacier, the loss of mass outweighs the gain, the balance is negative, it is the ablation zone. At the end of the ablation season, the winter snow disappeared and gave way to the ice of previous years.

schema glacier - glaciers - glaciers montagne - encyclopedie environnement - mountain glaciers - schematic section of glacier
Figure 1. Schematic section of a glacier with the upper net accumulation zone, the lower net ablation zone, and the equilibrium line of the glacier. The arrows inside the glacier indicate the flow of ice from the upper to the lower parts. [© P. Wagnon]
The boundary between these two zones constitutes, at the end of the hydrological year, the equilibrium line of the glacier (Figure 1). The imbalance in mass balances between the upper and lower parts of the glacier is compensated by the flow of ice along the slope. This is called the “dynamics” of the glacier. The thickness of a glacier thus varies constantly due to the balance between accumulation, ablation, and flow.

The annual surface mass balance is directly related to local weather conditions (precipitation, temperature, humidity, wind, radiation, see focus). Monitoring this parameter over the long term and on different glaciers around the world is therefore particularly interesting from a climate point of view.

1.2. Measurement of the surface mass balance

glaciers - glacier - glaciers montagnes - zone accumulation - zone ablation - schema glaciers - encyclopedie environnement - saint-sorlin glacier - mountain glaciers
Figure 2. Saint-Sorlin Glacier, autumn 2014, showing the boundary between accumulation zone (snow) and ablation zone (live ice). [© D. Six]
On Alpine glaciers, winter accumulation is measured manually and in spring, using surface cores evenly distributed over the entire glacier (Figure 3). The amount of snow deposited during the winter is measured by identifying the previous year’s level. The density of this accumulated snow is obtained by weighing, which makes it possible to convert this snow height into water height. Additional measurements using snow probes make it possible to increase the density of the measurement network by simply measuring snow depth. On the glaciers of the French Alps, about 40 measurement points are recorded each year (about ten in the form of cores, the rest using snow probe measurements).

glaciers - glaciers montagnes - alpes - mont blanc - carottage - encyclopedie environnement - alps - mountain glaciers
Figure 3. Late winter coring in the Alps (Mont Blanc massif) using a manual corer (left). The cores are then weighed to transform the snow depth into water depth (right). [© P. Ginot]
Removal is measured by the emergence of wooden stakes or stakes (“tags“) previously embedded in layers from previous years (Figure 2).

In the accumulation zone, these beacons are implanted in spring in the boreholes used to measure the accumulation. These posts will make it possible to monitor the summer snowmelt in this area.

In the ablation zone, 10 m long beacons are placed in the fall, before the winter snowfall, using a steam probe, in several locations representative of the ablation zone. The emergence of these beacons during the summer allows the loss of ice to be measured at each point in the ablation zone.

balises en bois glace - glaciers - glaciers montagnes - sonde vapeur - glacier argentiere - encyclopedie environnement - alps - mountain glaciers
Figure 4. Late winter coring in the Alps (Mont Blanc massif) using a manual corer (left). The cores are then weighed to transform the snow depth into water depth (right). [© Ch. Vincent]
Accumulation and ablation measurements are used to calculate the mass balance at any point of a glacier. This balance is expressed as a water level (taking into account the difference in snow and ice density). The integration of these balances over the entire glacier surface corresponds to the volume of water gained or lost by the glacier: this global mass balance is measured during the hydrological year. This volume variation is divided by the total surface area of the glacier, in order to be able to compare small and large glaciers (normalization). This results in an average water height or blade, which is the annual mass balance of the glacier’s surface area. For example, if the mass balance of the glacier is -1 m of water in 1 year, it means that the glacier has lost a volume of water equivalent to a 1 m blade of water spread over its entire surface.

1.3. Depending on the region, the mass balance of glaciers is sensitive to different meteorological parameters

The sensitivity of a glacier to weather variables is highly dependent on regional conditions:

  • In the Alps, ablation is strongly correlated with atmospheric temperature.
  • The so-called “maritime” glaciers, near the oceans (as in Scandinavia), are very sensitive to variations in precipitation.
  • Some regions of the world such as Pamir, in the western Himalayas, are heavily affected by the monsoon regime, which provides most of the rainfall.
  • In very dry regions, such as the Andes, sublimation (direct transformation from the solid phase of a body to the gas phase) plays an important role in ablation and strongly affects the energy balance since it consumes a lot of energy (and leaves less for melting, see focus).
  • The so-called “cold” glaciers, at very low temperatures (typically below -10ºC), located in high mountains (and in polar regions) must warm up to 0°C before melting begins. Their mass balance is therefore much less sensitive to warming.

It should be noted that the functioning of polar ice caps is quite different. Melting is not enough to remove the ice accumulated in the upper parts, and the glaciers come to throw themselves into the sea and eventually lose their accumulated mass via the “calving” of icebergs. This is the case with many of the “emissary” glaciers of the Antarctic ice cap. The mass balance of these glaciers is very sensitive to flow conditions (especially at the base of the glacier) and much less sensitive to surface melting processes.

The response of glaciers to climate change is therefore not identical in different regions of the world.

1.4. A glacier adjusts to climate through its mass balance

In any case, glacier flow plays an important role in this climate response by modifying the geometry of the glacier: its surface, length and thickness. However, this geometry itself influences the total mass balance. Indeed, if a glacier undergoes surface warming, surface melting will increase, its mass balance will decrease and, with a variable response time, its front will retreat: its surface thus decreases in its lower part. Since this reduction in surface area is located in the ablation zone, the total amount of melting of the glacier will decrease and its total mass balance tends to return to zero. Thus, the surface of a glacier adjusts to climatic conditions to move towards a state of equilibrium. As climatic conditions are never stable, such a balance is never exactly achieved in practice.

Thus, as the mass balance of an entire glacier adjusts, it is not the best indicator of climatic conditions. It is the point surface mass balance, i.e. the sum of accumulation and ablation measured at each point of the glacier, that is directly related to these conditions (see focus).

2. Fluctuations in alpine glaciers since the end of the last glaciation (Holocene)

During the last glaciation, the glaciers of the Alps occupied all the major valleys and extended into the Lyon plains. After the peak of the last glaciation, about 20,000 years ago, the glaciers began a very strong retreat that led them to their current configuration, in this interglacial period called the Holocene, which covers the last about 10,000 years. What is known about glacier fluctuations over the past 10,000 years?

2.1. Piecemeal and indirect knowledge at the beginning of the Holocene

At the scale of several millennia, we have only very indirect observations of successive advances and retreats, based on the positions of glacial moraines (accumulation of rocks of all sizes left by a glacier in its ablation zone), on pollens in peatlands, and on the study of tree rings (dendroclimatology). It seems that alpine glaciers have suffered a sharp decline in the first part of the Holocene, up to the climatic optimum maximum temperature within a Holocene period between 7,500 and 6,500 years before today, which was most likely the warmest period in the last 10,000 years. Freeze-up was then less than it is today.

Between 2,500 and 1,900 years before today, in Roman times, glaciers have declined sharply. They were as small or even smaller than they are today. But the second half of the Holocene also includes several cold episodes, including the “Little Ice Age“, which occurred in the Alps between the 14th and mid-19th centuries.

glacier - glaciers montagnes - glacier rhone - glacier rhone avant apres - encyclopedie environnement - rhone glacier - mountain glaciers
Figure 5. Rhone Glacier (Switzerland) at the beginning of the 20th century (author unknown) and in 2016. [© Ch. Vincent]
The fluctuations of alpine glaciers during the Little Ice Age are fairly well documented, mainly through ancient stories and engravings. During this period, the Aletsch glacier in Switzerland reached its maximum extent around the year 1350, then again during the periods 1580-1 650 and 1820-1 850. During these advances, the glacier is 3 to 3.5 km longer than it is today. The Mer de Glace in France has similar advances, also remarkable between 1,590 and 1,680 and between 1,820 and 1,850, when its length was nearly 2.5 km longer than that of 2,017. These glaciers then left moraine deposits in the landscape that were very characteristic of this period (Figure 5).

2.2. Evolution of glaciers since the end of the Little Ice Age

Since the middle of the 19th century, more quantitative observations have made it possible to detail the evolution of glaciers. In particular, a large number of measurements of glacier length (the position of the fronts) are available. Thanks in particular to old topographical maps and available field surveys, glacier variations tell us a far from uniform history of climate in the 20th and 21st centuries.

Admittedly, since 1850 and the end of the Little Ice Age, the vast majority of glaciers in the Alps have been decreasing. It is estimated that both surfaces and glacial volumes have decreased by an average of about half since the end of the Little Ice Age. But this average value conceals a great heterogeneity because some massifs have lost nearly 60% of their surface area (Vanoise and Ecrins massifs) with small glaciers that have totally disappeared and other glaciers that have fragmented, while some massifs have lost only 20 to 30% of their surface area (Mont-Blanc massif).

glacier - glaciers montagne - recul glacier - temperatures glaciers - encyclopedie environnement - glaciers temperature - mountain glaciers
Figure 6. Receding (in m) from the front of three large glaciers in the Mont-Blanc Massif since the end of the 19th century. The vertical axis represents the length lost by each glacier over time. We can distinguish the last small glacial flood from the 1960s to 1980s (re-advancement of the fronts) and the very strong decline of the last three decades. We also notice the temporal shift in the responses of the glacier fronts, the Bossons glacier having an almost instantaneous response to changes in surface mass balance. [Source: Vallot, Service des Eaux et Forêts, Observatoire GLACIOCLIM]
Nor is this a continuous decline over this period. Alpine glaciers have experienced some small glacial floods over the past 170 years, particularly during the last glacial advance between the 1960s and the mid-1980s (Figure 6).

Finally, over the past 3 decades, glaciers have declined considerably. The Mer de Glace and the Argentière glacier in the Mont-Blanc massif have receded by about 750 m. The Bossons glacier has receded by more than 1 km. Glacial tongues have also become considerably thinner. The glacier of the Mer de Glace has lost nearly 100 metres of thickness in its lower part since 1990 (typically plumbing the Montenvers train arrival station).

These geometric changes (shortening and thinning) perceptible in the landscape are a consequence of the change in surface mass balances, with a response time that varies from a few years to several decades. Thus, the very strong changes in glacial languages observed over the last 3 decades are linked to very negative mass balances since the mid-1980s.

2.3. The significant mass loss of alpine glaciers over the past 30 years

As explained above, the surface mass balance represents the response of glaciers to climate more accurately than their length. Unfortunately, mass balance measurements are much more recent (since the 1950s in France) and cover fewer glaciers. Only about thirty continuous series of mass balances in the world exceed 30 years.

The Alpine countries (France, Switzerland, Italy, Austria) have a long tradition of mass balance measurements. Thus, based on these observations, a recent exhaustive study showed that the average mass balance of all Swiss glaciers is -0.62 m of water per year during the period 1980-2010 (equivalent water loss on average over their entire surface). The French, Austrian and Italian mountain ranges in the Alps suffered more or less the same fate. For example, the mass balances of the glaciers of the Mer de Glace and Argentière are on average -0.90 and -0.80 m of water/year respectively between 1983 and 2016. Since 2003, mass loss has accelerated and the mass balances of alpine glaciers have been even more negative. The mass balances of the glaciers of the Mer de Glace and Argentière have, on average, been -1.70 and -1.40 m of water/year respectively since 2003, thus revealing even more significant losses in ice volume.

It is interesting to note that the fluctuations in mass balance from year to year are remarkably similar throughout the Alpine range, over a distance of 400 km. This was shown by a recent study that compared the evolution of the mass balances of six large glaciers in the Alpine chain between Austria and France over the past 50 years.

As explained in paragraph 1.3, the total mass balance of a glacier depends not only on climatic conditions, but also on the evolution of its surface and its imbalance. Typically, over the same period 2001-2016, the large Argentière glacier (Mont-Blanc massif, 19 km²) and the small Saint-Sorlin glacier (Grandes Rousses massif, 3 km²) lost 1.30 and 2.00 m of water per year respectively. These differences in balance are all the more significant if one adds up the annual mass balances over time. Thus, over the period 2001-2 016, the cumulative mass balance of Argentière is -20 m of water, that of Saint-Sorlin -30 m of water.

To overcome this climate sensitivity specific to each glacier, it is more relevant to study the evolution of point mass balances (at each point of the glacier) rather than the overall mass balances of glaciers. Compared to the period 1962-1983, when glaciers were in a near-equilibrium state (few thickness changes during this period), point mass balances show that melting increased by 0.85 m of water per year in the following period 1983-2002, and by 1.63 m of water per year in the last period 2003-2013.

These negative mass balances are due to summer warming and a 2 to 3 week extension of the ablation season, while the amount of snow has changed little in recent decades at high elevations.

3. Very high altitude glaciers: a specific response to climate change

In the Alps, almost all valley glaciers are so-called temperate glaciers, which means that the temperature of the glacier is close to the melting point of the ice. Above approximately 3,500 m (in the Alps), the ice is said to be “cold”, i.e. at very low temperatures (about -11°C at the base of the Dôme du Gouter glacier at 4,300m, on the normal Mont-Blanc access road, and -17°C at the base of the small ice cap that covers the summit of Mont-Blanc). The temperature of a glacier depends on many factors, including altitude, exposure, surface snow accumulation and glacier flow. In particular, when a glacier has an accumulation basin at very high elevations, such as the Bossons glacier or the Taconnaz glacier (Mont-Blanc massif), the cold ice formed at very high elevations warms slowly as it flows downward and keeps the glacier in a “cold” state until it reaches altitudes well below 3500 m.

Observations on these cold sites at high altitudes show two very specific characteristics: on the one hand, ice thicknesses have changed relatively little over the last century. On the other hand, their internal temperature has varied significantly.

Thus, the thickness of the Dôme du Gouter glacier (4,300 m) has only changed by a few metres over the past 3 decades. A study has shown that the thickness of this glacier (like the one covering the summit of Mont Blanc) has remained unchanged, with an uncertainty of a few metres, since the beginning of the 20th century, when Joseph Vallot and his cousins had undertaken precise topographic measurements in the Mont-Blanc massif. However, these glacial massifs preserved at very high altitudes represent only a small area in the Alps.

glacier - glaciers montagnes - perte epaisseur glacier - vertical temperature profiles measured in boreholes in the dome du gouter glacier
Figure 7. Vertical temperature profiles measured in boreholes in the Dôme du Gouter glacier (4300 m, Mont Blanc massif). The thickness of the glacier is 135 m and temperatures have been measured from the surface (depth 0 m) to the rocky bed. We clearly see a warming between 1994 and 2010. The ages correspond to the age of the ice. [Source: adapted from Gilbert and Vincent,[1]]
Nevertheless, although no change is noticeable at the surface, very high altitude glaciers are affected by atmospheric warming. It is their internal temperature that increases. The temperature profiles measured in these very high altitude glaciers provide a remarkable indicator of climate change at these altitudes where weather stations are not available. Unfortunately, these measures are still rare. Temperatures were measured in boreholes drilled at Col du Dôme (4,300 m, Mont-Blanc massif) from the surface to the rocky bed at a depth of 135 m, since 1994. The temperature of the ice is -11°C near the rocky bed. These observations indicate a very strong warming of the ice to over 1.5°C at a depth of 50 m in two decades (drilling of 1,994, 2,005 and 2,010) (Figure 7) [1]. Ice is actually an archive of the past because any change in temperature gradually penetrates deep into the past. These vertical temperature profiles thus make it possible to reconstruct the evolution of atmospheric temperatures over nearly a century: these reconstructions lead to the conclusion that the warming at these high altitudes is very similar to that observed in the plain.

4. The impacts of these glacier changes

Warming and the increase in associated melting have consequences, among other things, on glacier-related hazards. Thus, the warming of cold high-altitude glaciers will modify the stability of so-called “suspended” glaciers, located on very steep slopes and which owe their stability to the fact that their basal temperature is strongly negative (which prevents the circulation of water in contact with the rocky bed). These glaciers will be destabilized when the temperature at their base reaches the melting point (the friction of the glacier on the rocky bed will then be greatly reduced). This is typically the case in the upper area of the Taconnaz glacier (Mont Blanc massif) [2].

Another hazard is related to the lakes that form in the depressions left by the retreating glacier, and closed by moraine dams that are sometimes unstable (proglacial lake). There is a risk of sudden emptying when these lakes have no or insufficient outlet, which poses a threat to the inhabitants of the valleys. These hazards are particularly relevant in Nepal where many glaciers are covered with morainal debris and leave imposing frontal moraines after their retreat.

Finally, a pocket of water can form in a glacier (intra-glacial lake). It results from complex processes indirectly linked to climate. Fortunately, these phenomena remain exceptional. However, they can be very deadly. In 1892, the sudden emptying of the water pocket of the Tête Rousse glacier in the Mont-Blanc massif caused 175 deaths in Saint Gervais. A pocket of water had re-formed and was detected in time in 2010: it could have caused 3,000 deaths if it had broken [3].

5. Mountain glaciers around the world are generally retreating

During the 20th century, an international effort was made to better document the evolution of glaciers. Nevertheless, of the 250,000 glaciers recorded worldwide, only about 30 have more than 30 years of mass balance measurements. In-situ glaciological data therefore remain very poor. Aerial photographs and satellite images can partially fill these gaps. Aerial photographs make it possible to accurately reconstruct the relief of glaciers by comparing views taken from different angles (this is called photogrammetry), but they have only been available since the 1950s and do not cover all glaciated massifs. Satellite images are now a remarkable source of documentation for estimating glacier thickness variations. But the first images with sufficient resolution only date from the early 1980s and only become common from the 2000’s onwards, which is too recent if long-term trends are to be analysed. Reconstructions using meteorological data and analyses of glacier sensitivity to climate variables can also complete the set of observations.

All the observations and reconstructions available around the world show that mountain glaciers generally receded after the end of the Little Ice Age, generally around the middle of the 19th century, although for some massifs the decline began as early as the middle of the 18th century. There are strong regional disparities, probably related to the regional disparity in climate change but also to the different sensitivity of glaciers around the world (section 1.3). For example, “sea glaciers” near the Norwegian coast or near the west coast of New Zealand are particularly sensitive to changes in precipitation. In the Himalayas, Nepalese glaciers appear to be very sensitive to monsoons from Southeast Asia. Andean tropical glaciers (Bolivia, Peru) are very sensitive to El-Niño phenomena, etc.

A quick tour of the planet shows that mountain glaciers are currently in general decline, with a few rare exceptions. As in the Alps, the glaciers of Alaska, the Tropical Andes and Patagonia are suffering considerable mass losses. Alaskan glaciers have lost about 0.6 m in thickness per year over the past 10 years, and Canadian Arctic glaciers have lost between 0.3 and 0.7 m in thickness. Tropical Andean glaciers (Bolivia, Peru, in particular) have lost an average thickness of 60 cm to 1.00 m of ice each year for 40 years. African glaciers will soon disappear: the glacier surface at the summit of Kilimanjaro increased from 11.4 km² to 1.8 km² between 1912 and 2012. It will probably disappear completely over the next few decades.

Himalayan glaciers suffer somewhat less impressive losses, averaging about 20 cm of ice per year over the entire Himalayan arc. However, the precise data, obtained by satellite, do not exceed 20 years of observations in this region [4]. It should be noted that this average masks considerable regional disparities: to the east of the Himalayan range (Nepal, Bhutan), mass balances are between -0.4 and -0.7 m of water per year over the period 2000-2 016, while to the west of the range (Pamir), mass balances are slightly negative (about -0.1 m of water per year). In the Kun Lun range (north of Karakoram), mass balances are even slightly positive (+0.15 m/year) over this period 2000-2016, most probably due to an increase in rainfall.

For an overview of the evolution of these glaciers in the world, we can refer to Francou and Vincent’s book (2015)[5]. In addition, detailed data on glaciers observed around the world are available on the World Glacier Monitoring Service website (http://wgms.ch).

6. The future of glaciers: a very strong decline in the coming decades

Thanks to all the long series of measurements obtained on glaciers in the different regions of the world, it is now possible to simulate the evolution of glaciers both in the past to reconstruct their history and in the future to determine their evolution. These are major issues for estimating mountain water resources or the contribution of glaciers to sea level.

These future simulations are based on climate scenarios that predict different trajectories of parameters such as temperature and precipitation until the end of the 21st century (some even beyond). It should be noted that precipitation change scenarios are extremely uncertain, and this uncertainty affects glacier change scenarios. From these climate scenarios, our good understanding of climate control of mass balance allows us to estimate mass balance scenarios for each glacier. These mass balance scenarios are then combined with dynamic models that simulate glacier flow to predict future retreat and volume loss.

All the simulations show that the Alps’ glaciers will decline sharply in the coming decades, regardless of the climate scenario for the next 20 years. Indeed, glaciers are in such a state of imbalance compared to current conditions that their surface area is far too large compared to the climatic conditions of the last 30 years. Even if climatic conditions remained the same over the next few decades, the surface area of glaciers would decrease considerably before returning to a steady state. For example, with the average climatic conditions of the last 20 years, the largest glacier in the Alps, Aletsch, would lose 40% of its volume before returning to a steady state.

However, realistic modelling requires very precise information on the glacier studied (ice thickness, bedrock topography), which severely limits studies to a few glaciers in the world. With a relatively optimistic scenario of +2°C by 2100, the front of the Aletsch glacier (which is now 22 km long) is expected to retreat by 10 km and could lose 90% of its volume. It is estimated that, on an Alpine scale, between 80 and 95% of the current glacier surface could disappear by the end of the 21st century, depending on the climate scenario followed. This will affect water resources in part of Europe (read “The impact of climate change on snow cover and Alpine glaciers: consequences on water resources”)

glacier - glaciers montagnes - encyclopedie environnement - simulation of the shrinkage and loss of thickness - mountain glaciers
Figure 8. Simulation of the shrinkage and loss of thickness (colour) of the ice sea tongue for 2020 (a), 2030 (b) and 2040 (c), based on a simple glacial dynamics model and several climate scenarios: no temperature change (green outline), +0.02°C/year (yellow line) and +0.04°C/year (red line). [Source: according to Vincent et al., 2014]
In the Alps, glaciers that do not have an accumulation zone above 3,500 m altitude could all disappear before 2,100. Glaciers with an accumulation zone above 4,000 m are far from disappearing, although their glacier tongue will shorten considerably. For example, the Ice Sea front is expected to decline by 1 to 1.2 km (depending on the climate scenarios considered) over the next 30 years (Figure 8) [6].


Notes and references

Cover image. Public domain.

[1] Gilbert, A., C. Vincent, 2013. Atmospheric temperature changes over the 20th century at very high elevations in the European Alps from englacial temperatures, Geophysical Research Letters, 40, 2102-2108 DOI : http://dx.doi.org/10.1002/grl.50401

[2] Gilbert, A., C. Vincent, O. Gagliardini, J. Krug and E. Berthier (2015). Assessment of thermal change in cold avalanching glaciers in relation to climate warming, Geophys. Lett. Res. Lett., 42, doi:10.1002/ 2015GL064838. DOI: http://dx.doi.org/10.1002/2015GL064838

[3] Vincent, C., Garambois, S., Thibert, E., Lefebvre, E., Le Meur, E., Six, D. Origin of the outburst flood from Glacier de Tête Rousse in 1892 (Mont Blanc area, France). Journal of Glaciology, 56, 688-698. 2010. DOI: https://doi.org/10.3189/002214310793146188

[4] Brown F., E. Berthier, P. Wagnon, A. Kääb and D. Treichler. 2017. A spatially resolved estimate of High Mountain Asia glacier mass balances from 2000 to 2016. Nature Geoscience. 7 August 2017, DOI: 10.1038/NGEO2999

[5] Francou B. and C. Vincent. What’s new on the white planet. 2015. Editions Glénat. 143 p. EAN/ISBN : 9782344008157. Publisher link: http://nature.glenatlivres.com/livre/quoi-de-neuf-sur-la-planete-blanche-9782344008157.htm)

[6] Vincent, C., M. Harter, A. Gilbert, E. Berthier and D. Six. 2014. Future fluctuations of Mer de Glace, French Alps, assessed using a parameterised model calibrated with past thickness changes. Ann. Glaciol, 55(66), 15-24. doi: 10.3189/2014AoG66A050


环境百科全书由环境和能源百科全书协会出版 (www.a3e.fr),该协会与格勒诺布尔阿尔卑斯大学和格勒诺布尔INP有合同关系,并由法国科学院赞助。

引用这篇文章: SIX Delphine, VINCENT Christian (2019年2月8日), Mountain glaciers, sentinels of climate change, 环境百科全书,咨询于 2024年12月25日 [在线ISSN 2555-0950]网址: https://www.encyclopedie-environnement.org/en/climate/mountain-glaciers-sentinels-of-climate-change/.

环境百科全书中的文章是根据知识共享BY-NC-SA许可条款提供的,该许可授权复制的条件是:引用来源,不作商业使用,共享相同的初始条件,并且在每次重复使用或分发时复制知识共享BY-NC-SA许可声明。