Greenhouse effect
PDF
Explaining the greenhouse effect too often boils down to the atmosphere’s ability to absorb infrared radiation emitted by the surface. This presentation is overly simplistic and lends itself to sterile polemics. The aim of this article is to provide as comprehensive an explanation as possible, while remaining accessible to a wide audience. It will also show that the greenhouse effect is largely validated by the atmospheric temperature measurements made every day by meteorological satellites. The relative importance of the various greenhouse gases and their warming potential will also be discussed, as will the notion of climate sensitivity.
1. A brief history
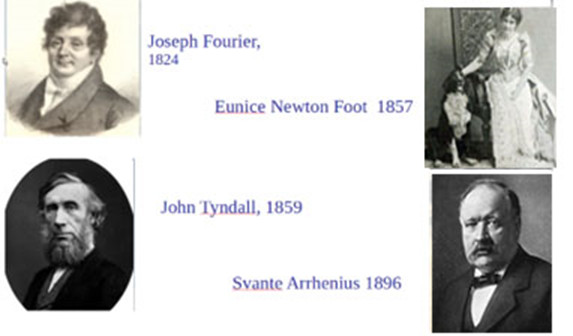
The greenhouse effect has been known since Joseph Fourier (Figure 1) in 1827, and the first estimate of the impact of a doubling of CO2 concentration dates back to 1896 by Svante Arrhenius (Figure 1). Meanwhile, in 1857, the American Eunice Foots (Figure 1), to whom we must pay tribute, demonstrated the ability of CO2 and water vapour to absorb radiation, and John Tyndall (Figure 1) carried out the first measurements of this absorption. A fuller account of the discovery of the greenhouse effect can be found in the article “From the discovery of the greenhouse effect to the IPCC“.
The term “greenhouse effect” seems to have been used formally only in 1901 by Nils Ekholm, a Swedish meteorologist very close to Svante Arrhenius. Taken literally, the expression is misleading. Heat can be exchanged in three ways: by conduction, convection or electromagnetic radiation. A description of electromagnetic waves can be found in the article on “The colours of the sky“. Conduction is by contact, convection by transport of matter.
As the Earth is isolated in space, it cannot exchange matter with the vacuum that surrounds it, and the only exchanges possible are by means of electromagnetic radiation. In a greenhouse, these radiative exchanges take place in the same way, but unlike on Earth, convective exchanges can take place if the doors are open, allowing warm air from inside to exchange with cold air from outside. These convective exchanges are far more important than radiative ones. The practical effect of a greenhouse is therefore mainly to let in solar radiation and block convection. Energy losses through radiation are indeed reduced by the glass, but the analogy with the atmosphere is not perfect.
2. The physical basics
2.1. Solar and telluric radiation
- the hotter a body is, the more it emits: this is Stefan-Boltzmann’s law:
F = σT4 where P is the emitted power in W/m2, T the absolute temperature (see the article “Pressure, temperature and heat“), expressed in degrees Kelvin (K) and σ = 5,67 10-8 Wm-2 K-4 is Boltzmann’s constant.
- the hotter a body, the more energetic the photons it emits, i.e. the higher their frequency, or equivalently, the shorter their wavelength.
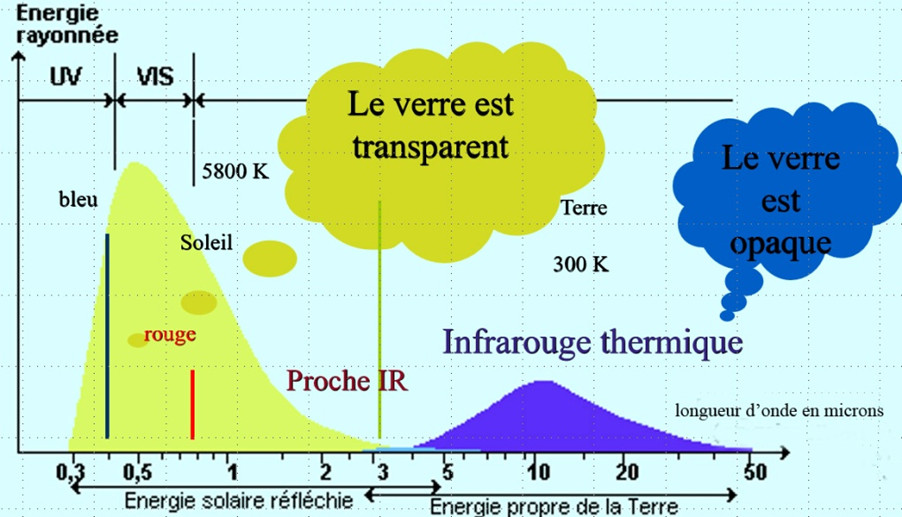
The temperature of the Sun’s photosphere, i.e. the zone from which its light emanates, is around 5800 K. With this emission temperature, almost 98% of the radiation emitted by the Sun corresponds to wavelengths below 3 µm. For the Earth, whose temperature is around 300 K, the opposite is true: over 99% corresponds to wavelengths longer than 3 µm. Glass is transparent at short wavelengths, corresponding to solar radiation, but opaque to infrared radiation, hence the term greenhouse effect (Figure 2). The atmosphere has a certain similarity with glass: it is mainly transparent to solar radiation and partially opaque to infrared radiation. This opacity is due to minority components such as CO2 and water vapor, while nitrogen and oxygen are almost totally transparent.
2.2. Radiative balance, radiative forcing
As seen above, the Earth’s only heat exchange with space is through radiation. It absorbs short-wave solar radiation, and emits so-called telluric radiation of long infrared wavelengths. Facing the Sun, the Earth presents a disk of radius R = 6400 km, surface area πR2 and therefore receives a total power πR2S0, where S0 =1360 W/m2 is the solar irradiance, i.e. the energy received per second from the Sun outside the atmosphere on a surface of 1m2 perpendicular to the direction of the Sun. The Earth directly reflects around 30% of this radiation. This proportion is called albedo and is denoted α. The Earth therefore absorbs a total power πR2(1-α)S0. In return, it emits its infrared radiation over its entire surface, which is that of a sphere of radius R, i.e. 4πR2. Calling F the infrared flux emitted by the Earth towards space, the total power emitted is then 4πR2F.
The difference between the power absorbed and the power emitted per unit area is therefore (1-α)S0 /4-F, a quantity we call the radiation balance. At equilibrium, this balance is zero; if it is positive, the Earth gains energy and warms up, otherwise it cools down. These two terms are each worth around 240 W/m2. Following Stefan Boltzmann’s law, the temperature would then be 255 K (or -18° C), assuming a uniform distribution over the Earth.
A disturbance in this balance, due for example to an increase in greenhouse gases, as discussed below, or to a variation in solar irradiance, is known as radiative forcing. It is a constraint to which the climate adapts by redistributing the surplus or deficit of energy between its various components. Persistent radiative forcing leads to a new climatic equilibrium, with a new average temperature.
3. How does the greenhouse effect work?
3.1. A very simple model: the Earth under a layer of glass
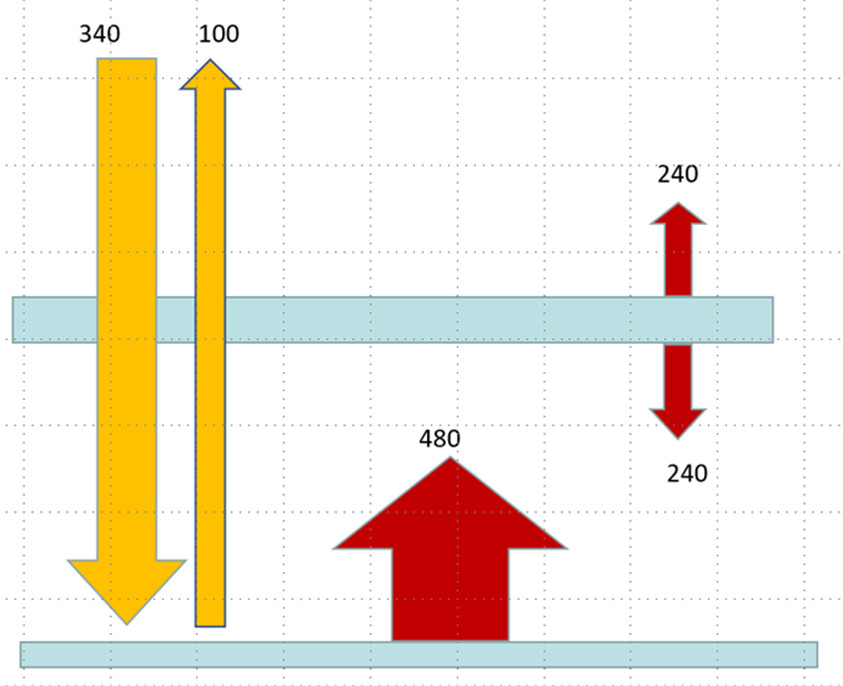
For the radiation balance to be balanced, the glass layer must emit an infrared flux equal to the solar energy absorbed, in this case 240 W/m2, so its temperature is close to 255 K, but it also emits this flux downwards. This time, the surface absorbs 480 W/m2, so its temperature is 303 K. With two layers of glass, the temperature rises to 338 K. With 3 layers of glass, the surface temperature rises to 363 K. The greenhouse effect is therefore not saturated.
3.2. A more realistic atmosphere
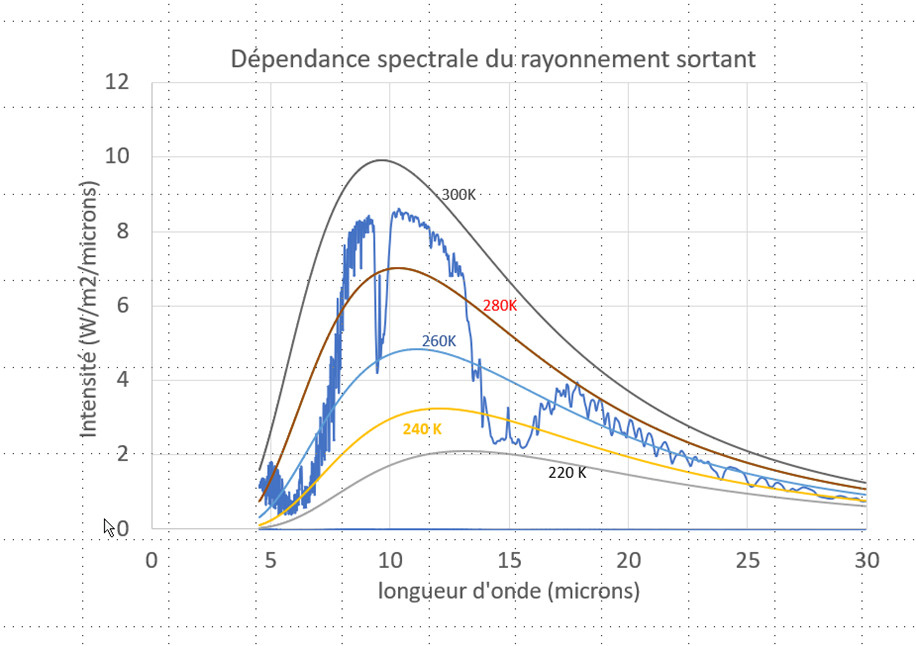
If the atmosphere were completely transparent at all wavelengths, a satellite-borne spectro-radiometer would observe the emission from the surface, whose spectral dependence would be that of a black body (see The thermal radiation of the black body). As we saw above, the temperature of this black body would be close to 260 K, so we would observe the regular blue curve marked 260 K in Figure 5 [4]. If the atmosphere were really equivalent to a layer of glass, the same curve would be observed, since the glass layer would be at the same temperature.
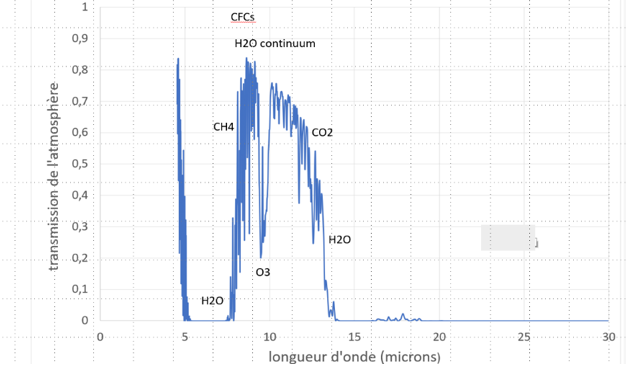
At around 10 µm, atmospheric transmission is high, close to 80% here. This is the region of what we call the atmospheric window, and it is this region that enables us to measure surface temperature from a satellite. At around 15 µm, no photon can pass through the entire atmosphere without being absorbed, so the photons we observe come from higher altitudes, reaching the stratosphere.
3.3. A fuller description of the greenhouse effect
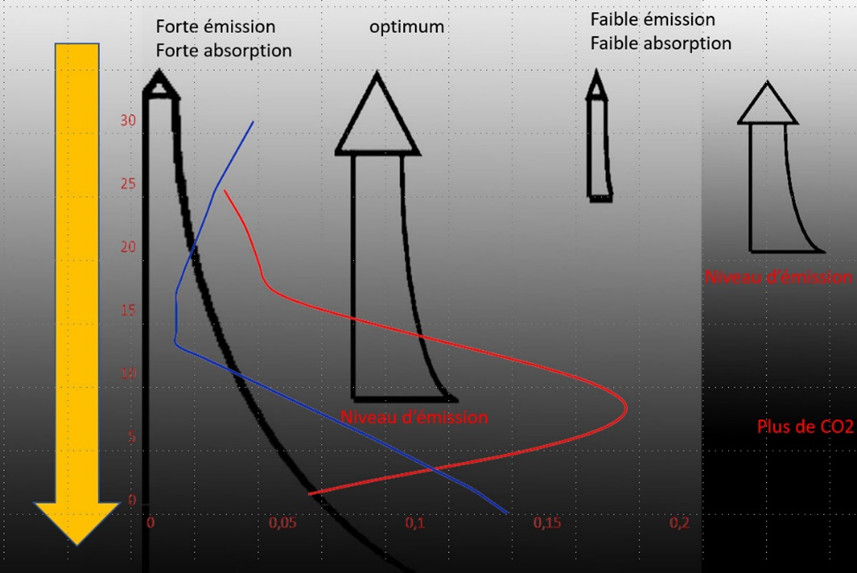
Unlike the glass layer, the atmosphere is thick and not isothermal. Temperature decreases with altitude, by an average of 6.5°C per km, and as pressure decreases with altitude, so does the concentration of absorbing molecules (see Earth’s atmosphere and gaseous envelope). Consequently, for a well-mixed gas like CO2, emission decreases with altitude. It is therefore highest at the surface and in the lowest layers, but the radiation emitted at these levels encounters a maximum number of absorbing molecules before escaping into space. Conversely, the highest layers emit little radiation, but this radiation is poorly absorbed. It is easy to see that there is an optimum, corresponding to an altitude at which emission is still high and absorption fairly low. The contribution of this level of the atmosphere to outgoing radiation is at its maximum, and is called the emission level. The altitude of this emission level depends on the absorption of the atmospheric layers, which in turn depends on the product of the quantity of absorbing molecules and their absorption coefficient.
This coefficient is specific to each energy transition, so it varies greatly with wavelength, as does the emission altitude. Instruments that measure atmospheric temperature from satellites exploit this property. These soundings and their direct assimilation into weather forecasting models have led to considerable improvements in forecasting. As the physical theory behind the greenhouse effect is identical, they provide indirect validation.
Figure 1 in the article on The average temperature of the earth, shows the various components of the average energy balance. The average surface temperature is around 16.5°C, so it emits around 398 W/m2, while the outgoing infrared flux is 239 W/m2. The greenhouse effect, measured as the reduction of emitted infrared flux by the atmosphere, is 159 W/m2, and the brightness temperature of the photosphere is around 255 K. Its altitude, for a standard atmosphere (US standard atmosphere [5]), is around 5.1 km. If the concentration of absorbing gas increases, the optimum occurs at a higher altitude and therefore at a lower temperature. As a result, outgoing radiation decreases. It should be noted that the greenhouse effect is only possible because temperature decreases with altitude. For an isothermal atmosphere at the same temperature as the surface, there would be no greenhouse effect. This is what happens in the spectral regions of the absorption maximum of the CO2 band around 15 µm, where the emission level is located in the stratosphere, where the temperature is more or less constant.
4. The different greenhouse gases
For molecules with more than two atoms, there are possible transitions (see focus) between rotation or rotation-vibration energy states corresponding to infrared spectrum frequencies. This is particularly true of gases such as carbon dioxide (CO2), methane (CH4), water vapor (H2O), nitrogen peroxide (N2O) and many other molecules present in trace amounts in the atmosphere. The greenhouse effect of these gases depends on their absorption spectrum and spatial distribution.
The most important of these is water vapor, whose spectrum covers a very wide portion of the infrared range, with the exception of the semi-transparent “atmospheric window” between 8 and 12 µm. Carbon dioxide has two absorption bands in the infrared at around 4.7 µm and 15 µm, but its greenhouse effect is exerted mainly via the 15 µm band, which intercepts a much greater proportion of telluric emission (see Figures 5 & 6). Water vapour also absorbs at around 15 µm, as the photons absorbed by one gas cannot be absorbed by the other, leading to very different estimates of the importance of each in the natural greenhouse effect.
Water vapour is responsible for around 50-70% of the natural greenhouse effect, but its concentration in the atmosphere is governed by temperature. Anthropogenic emissions of water vapour have a negligible influence, but the increase in atmospheric water vapour concentration that results from the rise in temperature, and the consequent increase in the greenhouse effect, constitute a very powerful feedback [6] that strongly amplifies the warming initially caused by anthropogenic GHGs (see the focus A look back at the greenhouse effect of water vapour and CO2). A GHG’s radiative forcing is all the more effective because it absorbs where other GHGs do not. From this point of view, the most effective gases are those that absorb in the “atmospheric window” of water vapour, such as methane, ozone and CFCs and their derivatives (see Figure 6).
CO2 is indeed the main contributor to the greenhouse effect, but accounts for less than 60% (Table 1). In addition to its direct influence on the greenhouse effect, methane also has an indirect influence via ozone, of which it is the main source in the lower atmosphere. The case of ozone is complex because it also absorbs solar radiation, and its vertical distribution is not uniform. Table 1 is taken from the IPCC’s sixth report. The radiative forcing of all greenhouse gases from 1750 to 2019 is 3.8 W/m2. Other forcings, mainly aerosols, reduce the total anthropogenic forcing to 2.7 W/m2.
Table 1. Radiative forcings and relative importance of different GHGs in the increase in the greenhouse effect since 1750. Based on IPCC 6th report, Group 1, chapter 7 [7]. Radiative forcing of CO2 [8].
| GHG | Relative increase in concentration (%) since 1750 | Radiative forcing since 1750 (W/m2) | Share in greenhouse effect increase (%) |
| CO2 | 50 | 2,16 | 56 |
| CH4 | 160 | 0,54 | 14 |
| N2O | 22 | 0,21 | 6 |
| CFCs and substitutes | 0,41 | 11 | |
| Ozone | 0.47 | 12 |
5. Global warming potential
The second factor influencing the impact of a GHG’s radiative forcing on climate is its lifetime (Table 2). In this respect, we need to distinguish between the residence time of a molecule in a biogeochemical cycle in which the elements are constantly renewed, and the time after which an additional molecule is absorbed by one of the sinks in this cycle. For CO2, for example, the residence time is of the order of a few years, but it’s only after around a hundred years that the additional CO2 is halved (see A carbon cycle disrupted by human activities). For methane, the residence time is around 11 years, and several thousand years for Freon 14 (CF4).
For one kg of gas injected into the atmosphere, the effectiveness of a GHG, also known as its Global Warming Potential (GWP ), is measured by the total radiative forcing, i.e. the increase in the greenhouse effect it causes throughout its lifetime. It is related to the same quantity as CO2, but with a time horizon common to all GHGs, usually 100 years. It is therefore : ![]() . Here ax(t) represents the decrease in the quantity of GHG x as a function of time, RF its radiative forcing and H, the time horizon.
. Here ax(t) represents the decrease in the quantity of GHG x as a function of time, RF its radiative forcing and H, the time horizon.
Table 2. Lifetimes and Global Warming Potentials (GWP) of the main anthropogenic GHGs. Note that CO2 sinks are multiple and have very different time constants. CFCs and their replacements are very numerous, so the list is incomplete; the last three gases are given by way of example, according to the 5th IPCC report, Group 1, appendix 8 [9].
| GHG | Lifetime (years) | GWP at 20 years | GWP at 100 years |
| CO2 | 100 | 1 | 1 |
| CH4 | 12,4 | 84 | 28 |
| N2O | 121 | 264 | 265 |
| CFC-11 | 45 | 6900 | 4660 |
| HFC-32 | 5,2 | 2430 | 677 |
| Freon 14 | 50 000 | 4880 | 7400 |
6. Climate sensitivity
In 1896, Svante Arrhenius calculated that the Earth would warm by 5°C if CO2 concentration continued to double. Since then, we’ve become accustomed to assessing climate sensitivity in this way. In the 1960s, Syukuro Manabe (see article “On the contributions to climate physics of Klaus Hasselmann and Syukuro Manabe, Nobel Prize 2021“) and Robert Stickler, followed by Richard Wetherald, repeated this calculation, first with a one-dimensional vertical model and then, in 1975 [10], with a simplified three-dimensional model taking atmospheric movements into account. Their result, just under 3°C, remains the central value of estimates made since then [11]. Climate sensitivity can easily be calculated using models that take into account the physical processes at work in the climate system. The difficulty lies mainly in the precision with which the various feedbacks (see The climate machine) can be estimated, particularly cloud feedback. By comparison, the uncertainty involved in calculating the greenhouse effect of GHGs is low, estimated at around 10%.
For recent data, the main source of uncertainty lies in the ability to distinguish the climate signal from natural variability. Another major source of uncertainty lies in estimating the effect of aerosols. In addition, long-lasting feedbacks such as the response of the ice caps are not, or only partially, integrated, so that the balance of the radiation budget is not achieved. The sensitivity that can be estimated in this way is a transient sensitivity. In models, it is simulated by increasing CO2 concentration by 1% per year.
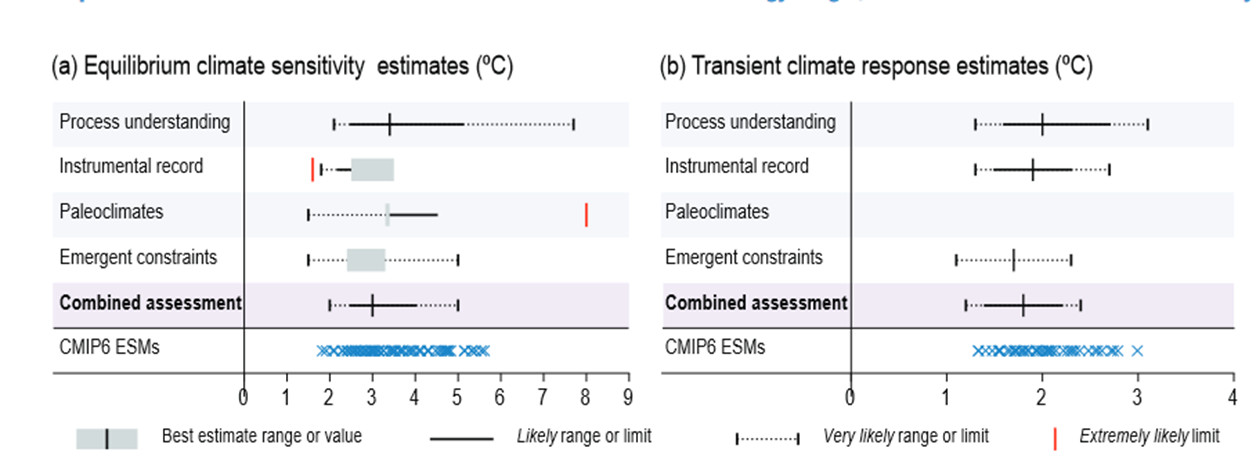
In the case of paleoclimatic data, the difficulty lies more in estimating forcings. Figure 8, taken from the latest IPCC report, summarizes the various estimates of equilibrium (left) and transient (right) sensitivities. Despite advances in models and 50 years of observations, the dispersion of estimates remains wide (between 2.5 and 4°C is the most likely range for equilibrium sensitivity).
7. Messages to remember
- Gases whose molecules contain more than two atoms absorb and emit infrared radiation.
- In the earth’s atmosphere, these are mainly water vapor (H2O), methane (CH4), nitrogen peroxide (N2O), ozone (O3) and chlorofluorocarbons (CFCs) and their replacements.
- These “greenhouse gases” absorb infrared radiation emitted by the surface and underlying atmospheric layers, and emit it in turn.
- As temperature decreases with altitude in the lower atmosphere, emission decreases with altitude, reducing the outgoing flux. In this way, an increase in greenhouse gases leads to a rise in temperature at the Earth’s surface, until a new equilibrium is found by increasing its infrared radiation.
- The greenhouse effect does not saturate: it increases without limit as the concentration of greenhouse gases rises.
- CO2 is the main contributor to the increase in the greenhouse effect since 1750, but accounts for less than 60% of the total increase. Water vapor is not directly taken into account among these factors, even though it dominates the greenhouse effect. Its concentration is in fact governed by meteorology, increasing strongly with temperature, which amplifies the effect of other gases.
- Climate sensitivity is measured by the increase in global temperature for a doubling ofCO2 concentration. It is estimated at between 2.5 and 4°C (most likely values).
Notes and references
Cover image. © Photo by the author.
[1] Keeling. C, Bacastow.R, Bainbridge.A, Ekdahl.C, Guenther.P, Waterman.L, Chin.S (1976). Atmospheric carbon dioxide variations at Mauna Loa Observatory, Hawaii. Tellus 28,6 538-55.
[2] Electromagnetic radiation is light in the broadest sense of the term. It includes not only visible light, but also infrared and microwave radiation, ultraviolet radiation, X-rays and the alpha, beta and gamma rays of radioactivity. Matter, in this case, is the gases, liquids and solids present in the atmosphere and on the surface.
[3] A photon is an elementary particle (or corpuscle) that carries the elementary light energy or light energy quantum of the electromagnetic wave.
[4] MODTRAN Infrared Light in the Atmosphere, University of Chicago, http://climatemodels.uchicago.edu/modtran/modtran.doc.html
[5] http://modtran.spectral.com/static/modtran6/html/help_atmosphere_model.html?v=3
[6] A feedback is the variation in the radiation balance resulting from the variation in a climatic parameter, itself due to the variation in temperature caused by the initial forcing. A typical example is the albedo feedback: gHG forcing causes warming, but in a warmer climate the extent of snow and ice decreases, which lowers the albedo, increases the solar energy absorbed and contributes to a further rise in temperature. This feedback, which amplifies the initial forcing, is said to be positive; the water vapour feedback is also positive, because the capacity of the atmosphere to hold water vapour increases with temperature by around 7% per degree, which in turn increases the greenhouse effect of water vapour.
[7] Forster, P., T. Storelvmo, K. Armour, W. Collins, J.-L. Dufresne, D. Frame, D.J. Lunt, T. Mauritsen, M.D.Palmer,M. Watanabe, M. Wild, and H. Zhang, 2021: The Earth’s Energy Budget, Climate Feedbacks, and ClimateSensitivity. In Climate Change 2021: The Physical Science Basis. Contribution of Working Group I to the Sixth Assessment Report of the Intergovernmental Panel on Climate Change [Masson-Delmotte, V., P. Zhai, A. Pirani,S.L. Connors, C. Péan, S. Berger, N. Caud, Y. Chen, L. Goldfarb, M.I. Gomis, M. Huang, K. Leitzell, E. Lonnoy,J.B.R. Matthews, T.K. Maycock, T. Waterfield, O. Yelekçi, R. Yu, and B. Zhou (eds.)]. Cambridge University Press, Cambridge, United Kingdom and New York, NY, USA, pp. 923-1054, doi:10.1017/9781009157896.009.
[8] The radiative forcing of CO2 increases approximately as the logarithm of concentration, RFCO2=5,36 ln(c/c0) where c and c0 are concentrations in ppm. So a doubling of CO2, i.e. ln(c/c0 )=ln(2)=0,693, leads to a radiative forcing of 3.7 W/m2
[9] Myhre, G., D. Shindell, F.-M. Bréon, W. Collins, J. Fuglestvedt, J. Huang, D. Koch, J.-F. Lamarque, D. Lee, B. Mendoza,T. Nakajima, A. Robock, G. Stephens, T. Takemura and H. Zhang, 2013: Anthropogenic and Natural Radiative Forcing. In: Climate Change 2013: The Physical Science Basis. Contribution of Working Group I to the Fifth Assessment Report of the Intergovernmental Panel on Climate Change [Stocker, T.F., D. Qin, G.-K. Plattner, M. Tignor, S.K. Allen, J. Boschung, A. Nauels, Y. Xia, V. Bex and P.M. Midgley (eds.)]. Cambridge University Press, Cambridge, United Kingdom and New York, NY, USA.
[10] Manabe, S, Wetherald, RT. 1975. The Effects of Doubling theCO2 Concentration on the climate of a General Circulation Model. J. Atmos. Sci. 32, 3-15.
[11] More generally, climate sensitivity represents the variation in global temperature in response to a perturbation of the radiation balance, i.e. radiative forcing. Since the radiative forcing caused by a doubling of CO2 concentration is around 3.7 Wm-2, a sensitivity of 3°C for a doubling of CO2 corresponds to around 0.8°C/ Wm-2.
The Encyclopedia of the Environment by the Association des Encyclopédies de l'Environnement et de l'Énergie (www.a3e.fr), contractually linked to the University of Grenoble Alpes and Grenoble INP, and sponsored by the French Academy of Sciences.
To cite this article: FOUQUART Yves (January 5, 2025), Greenhouse effect, Encyclopedia of the Environment, Accessed April 6, 2025 [online ISSN 2555-0950] url : https://www.encyclopedie-environnement.org/en/climate/greenhouse-effect/.
The articles in the Encyclopedia of the Environment are made available under the terms of the Creative Commons BY-NC-SA license, which authorizes reproduction subject to: citing the source, not making commercial use of them, sharing identical initial conditions, reproducing at each reuse or distribution the mention of this Creative Commons BY-NC-SA license.