Ground weather observations: what is measured and what is done with it?
PDF
How is the state of the atmosphere characterized in ground-based weather stations? What quantities are measured and with which sensors? For several decades, the meteorological parameters required for forecasting (air temperature and humidity, precipitation, winds, solar radiation, visibility, and others) as well as all observation procedures have been standardized by the World Meteorological Organization (WMO). This makes it possible to exchange the measured values on a global scale in order to obtain a global description of the Earth’s atmosphere. Other observations from satellites, balloons, aircraft or ships, also standardized, complete this diagnosis to determine the initial state of the atmosphere, from which powerful calculations can be made to predict its evolution.
The numerical weather forecast requires first of all to determine an initial state of the atmosphere, before calculating successive states, step by step, with the most powerful supercomputers. Knowledge of this initial state requires the collection of very diverse data, from a very large number of sensors, located on the ground in stations dedicated to this mission, at sea in ships, in the air in aircraft, or in the upper atmosphere in satellites (see Introduction to weather forecasting). This article reviews ground-based measurement equipment with an emphasis on accuracy and the need to make data collection as fast and centralized as possible.
- 1. What are ground-based observation networks?
- 2. What do these observations represent?
- 3. Measurement uncertainty
- 4. Air temperature measurement
- 5. Measurement of air humidity
- 6. Surface wind measurement
- 7. Precipitation measurement
- 8. Radiation and sunshine
- 9. Visibility measurement
- 10. Cloud altitude and extent
- 11. Observation of the nature of precipitation
- 12. Automatic stations and data concentration
- 13. Messages to remember
1. What are ground-based observation networks?
Ground-based meteorological observations are the oldest and most classical of the atmospheric diagnostic methods. They make it possible to reach direct physical parameters, such as temperature, pressure, wind, precipitation. The volume of data thus accessible is only a relatively small fraction of the total number of observations used in numerical prediction models (see Meteorological Data Assimilation). But they constitute a soil “truth” and concern physical parameters that are most often directly felt by humans and their constructions.
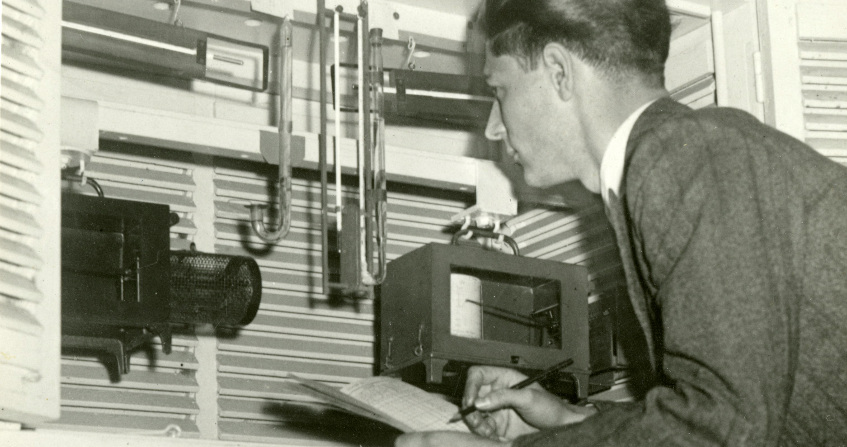
The first measurements made concerned air temperature, atmospheric pressure and precipitation. Sensors invented centuries ago are still in use, although some are now being abandoned, such as mercury barometers, mercury and alcohol thermometers, and collection rain gauges (in buckets).
– Notions of networks and scales
The state of the atmosphere is the global consequence of phenomena of very diverse spatial and temporal scales that mix and sometimes need to be separated. A distinction is made between:
- the synoptic scale, which describes phenomena affecting the general circulation of air masses over areas several hundred kilometres wide and time periods of several hours or even several days,
- the micro-scale, relating to spatial dimensions of a few hundred metres and periods of a few minutes, which includes turbulence phenomena,
- and the mesoscale, intermediate between the two previous ones, with spatial dimensions of a few kilometres or tens of kilometres, and periods of around a few hours.
There is no government network dedicated to documenting the micro-scale, however, an increasing number of individuals are acquiring commercially available mini weather stations. We are therefore beginning to be able to document this scale in large cities, provided that we exercise very strict quality control of these new data.
– Purpose of the different networks
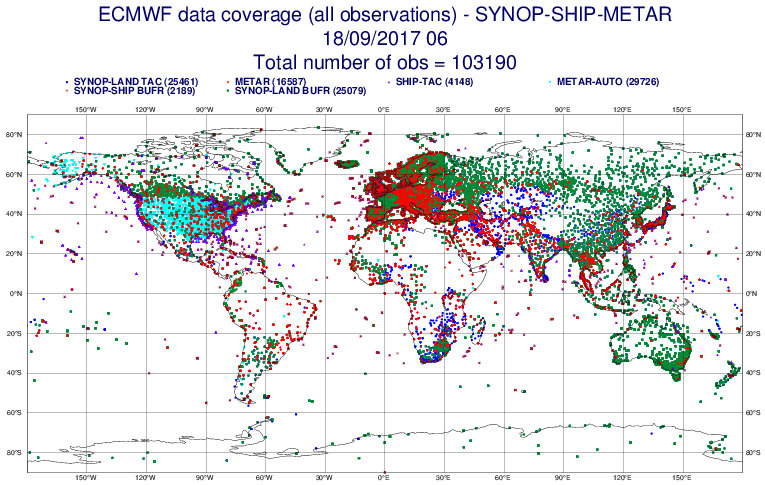
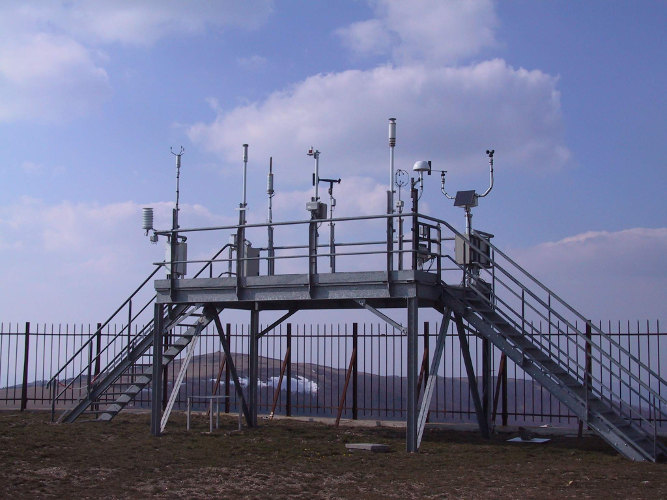
From the beginning, synoptic networks have been used to establish an instant “picture” of the state of the atmosphere. Measurements are made with instruments whose characteristics are now standardized; their exposure is identical in all stations and their operation is carried out according to methods codified according to the recommendations of the Guide [1] of the Commission on Instruments and Methods of Observation (CIMO) of the World Meteorological Organization (WMO). Synoptic measurements are performed simultaneously every hour by all stations around the world (Figure 1). They concern first of all basic parameters such as atmospheric pressure, air temperature and humidity, wind strength and direction at 10 m above the ground, precipitation amounts. These parameters are now all measured by automatic stations. They also concern visual or more qualitative parameters such as visibility, cloud layers and present weather (this expression refers to the nature of precipitation and the darkening of the atmosphere), which are more difficult to quantify and more costly to automate. Traditionally, they were observed humanely, now their automation is widespread: thus, in 2017, Météo-France stopped human observation on a synoptic scale.
To complete the “historical” synoptic network, there is in France a dense network (about 3000 stations) of climatological stations run by quasi-volunteers, with daily measurements of precipitation quantities and sometimes air temperature extremes. These measures are still manual, their automation is planned by 2022.
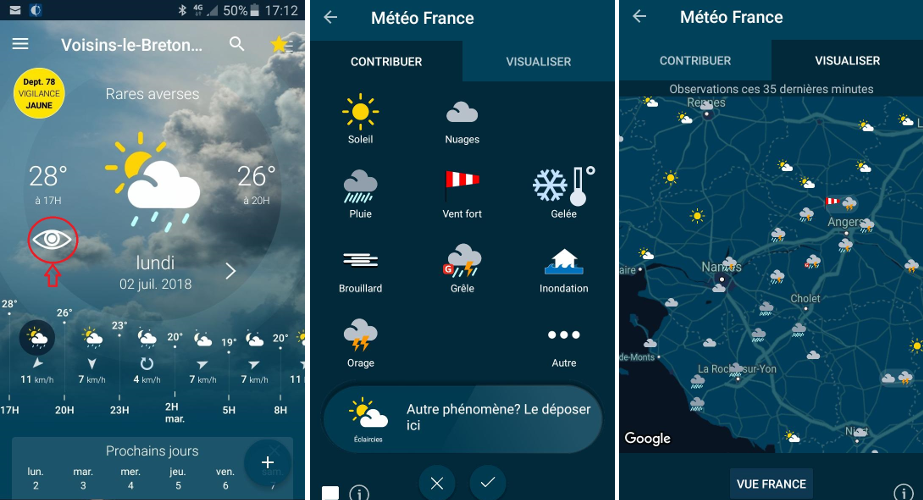
To complement the State networks, Météo-France recently launched a mobile participatory observation application [3] (Figure 2). Each citizen can, if he or she wishes, provide information on his or her smartphone about the nature of the precipitation he or she observes where he or she is, as well as other information related to the weather situation. These new observations are highly appreciated by forecasters (see the articleThe role of the forecaster), with an average of 30,000 observations per day.
2. What do these observations represent?
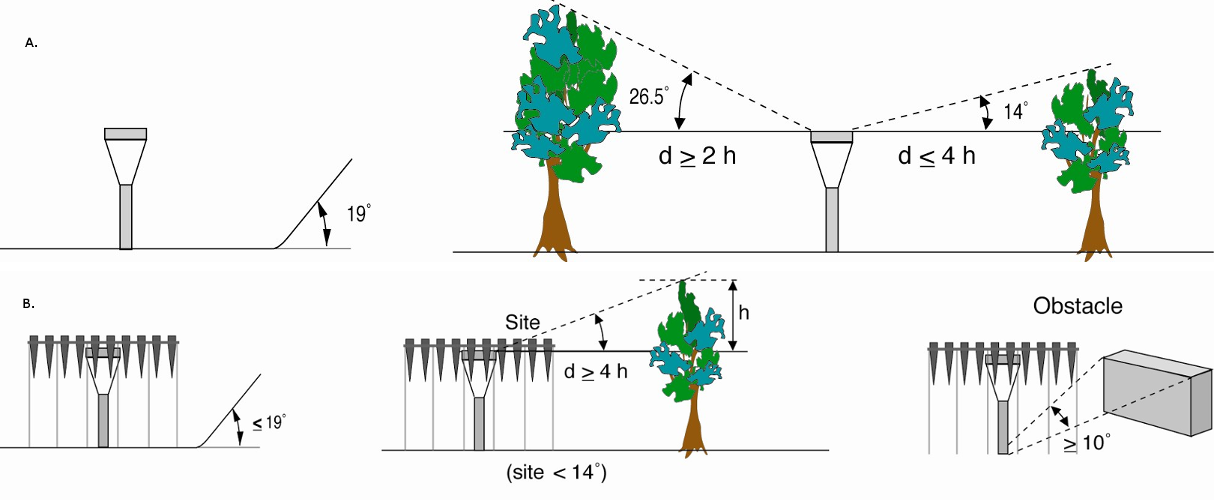
Often, the environment of a station or instrument distorts the result and alters its representativeness, especially when a site is supposed to represent a relatively large area (e.g. between 100 and 1,000 km² for synoptic stations). In the Guide to Meteorological Instruments and Methods of Observation (WMO No. 8), WMO sets out the clearance rules for the various sensors. But what should be done when the conditions described are not met?
There are sites that do not respect these ideal clearance rules. WMO, based on the practices of Météo-France since 1998, defined in 2010 a classification [4] of the environment of measurement sites to determine their representativeness on a small scale, based on the influence of the surrounding environment. This classification is also included in ISO 19289. Thus, a Class 1 site will be considered a reference site, while a Class 5 site will be a site where nearby obstacles create an inappropriate environment for carrying out meteorological measurements that are supposed to be representative of a large area (at least a few dozen square kilometres) and where it is not advisable to carry out such measurements. The better the site is classified, the more representative the measurement is of a large area. Although there are obstacles to measurement, a poor class site (high class number) may still be of interest for a particular application.
3. Measurement uncertainty
The overall uncertainty affecting a meteorological measurement is difficult to assess because the measurement is not carried out under well-controlled environmental conditions, as can only be done in a laboratory. It is precisely the environment that we want to measure! Thus, the measurement of a particular quantity – the temperature of the air, for example – can be disturbed by various atmospheric parameters such as wind, radiation and others.
The measurement uncertainties can therefore be broken down into 3 main sources:
- Those related to the characteristics of the instruments themselves. They are usually published by the manufacturer, sometimes with an indication of some influencing factors, which have been tested in the laboratory. This is particularly the case for hygrometer characteristics that are subject to a significant temperature influence between -20°C and +40°C. Appendix 1A of the CIMO guide indicates both the uncertainties desired by users and the achievable measurement uncertainty.
- Those related to maintaining (or not maintaining) the sensor under nominal operating conditions: for example, the frequency of sensor cleaning and calibration.
- Finally, as mentioned above, the environment close to the measurement and the exposure of the instruments have an important influence on the representativeness of the measurement and therefore on the uncertainty that can be assigned to its meaning.
4. Air temperature measurement
The most commonly used electronic thermometers are platinum wire thermoresistors [5], whose most common normalized value is 100 Ohms at 0°C (Pt100). These sensors are therefore interchangeable on site, without any adjustment required. The uncertainty of a typical Pt100 probe over the current measurement range (-40°C to +60°C) is 0.1°C (1/10th of DIN IEC 751) or 0.25°C (class A standard IEC 751), depending on the tolerance of the chosen sensor. Its stability over time is very good, a calibration every 5 years may be sufficient.
5. Measurement of air humidity
To characterize the hygrometric state of the atmosphere, meteorologists use several parameters, which are not independent of each other. The formulas linking these various parameters are available in particular in Appendix 4.B of Chapter 4 of the CIMO Guide5. Here is the list of these parameters:
- the mixing ratio r, expressed in g.kg-1: ratio of water vapour mass to dry air mass;
- the vapour pressure e’, expressed in hectopascals: partial pressure of water vapour in the air; the saturation vapour pressure is noted e’w, it is an increasing function of temperature (hot air can contain more water vapour than cold air);
- the dew point temperature Td, expressed in degrees : temperature at which a mass of humid air must be cooled to reach saturation;
- the relative humidity U in relation to liquid water, expressed in % : ratio between the vapour pressure e’ and the saturation vapour pressure e’w.
– Vapour pressure measurement
One of the oldest methods for measuring the hygrometric state of the atmosphere is to use a psychrometer. It is a device composed of 2 thermometers: the first measures the temperature t of the dry air, the second the temperature t’ of a wet thermometer using a wick dipped in a water tank. Evaporation cools the wet thermometer and is more intense when the air is dry. This is expressed by the relationship e’w – e’ = Ap(t-t’), where p denotes the atmospheric pressure and A denotes a psychrometric constant depending on the geometry and especially on the ventilation of the sensor, which should be at least 2 m/s.
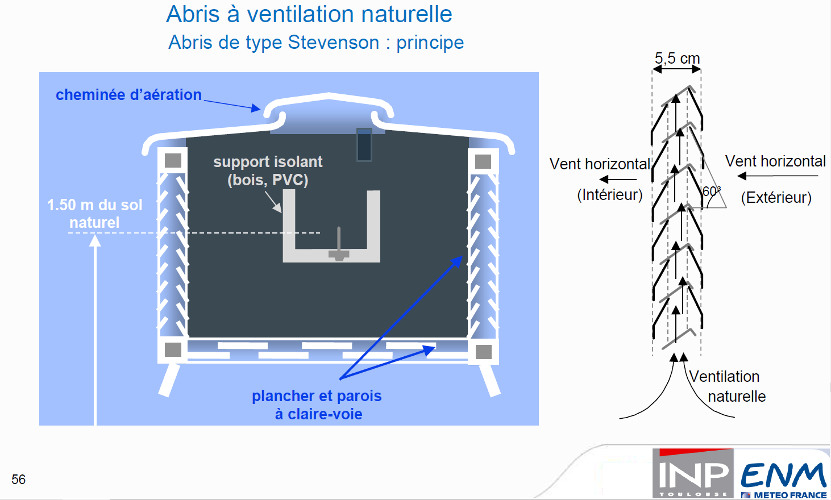
The naturally ventilated psychrometers used in the past under shelters were not very accurate, due to the internal ventilation of the shelter, poorly controlled and dependent on weather conditions. It is preferable to control this ventilation with a forced ventilation psychrometer, such as an Assmann psychrometer [6], used as a reference in the past. The psychrometer rattles, formed by a handle around which the operator can rotate a frame with the 2 thermometers is a good solution, but manual! It should also be noted that a psychrometer requires a positive temperature for continuous operation.
– Relative humidity measurement
– Dew point temperature measurement
Some manufacturers use simultaneous measurement of temperature and relative humidity under the same shelter, with artificially heated air to limit variations in relative humidity and use the hygrometer under optimal conditions to minimize its uncertainty. The combination of temperature and humidity then calculates the dew point [7] Td.
Condensation hygrometers measure the dew point directly by cooling a mirror by Peltier effect [8]. An optical detector is then used to identify the appearance of dew on the mirror, whose temperature is measured by an integrated thermometer. These devices are quite expensive and are used in the laboratory as references, although there are some models suitable for continuous outdoor operation.
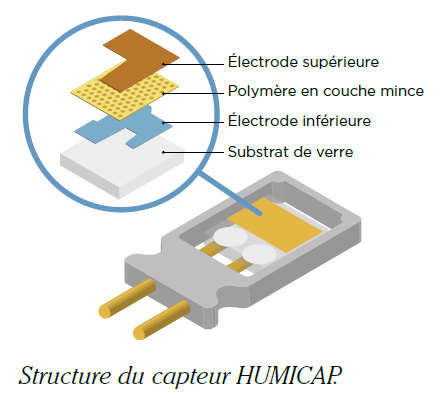
Capacitive hygrometers are sensitive to pollution and require regular calibration, typically every year, at a cost in the same order of magnitude as the sensor! Calibrations are often performed over a saturated saline solution, which makes it possible to make a well-known fixed point. For example, some commonly used references are: 11% with LiCl, 33% with MgCl2, … 75% with NaCl. The method is simple, but requires precautions and a standard hygrometer to determine the actual value.
6. Surface wind measurement
Wind speed is a three-dimensional vector quantity, but in meteorology we are mainly interested in its horizontal projection. Its high temporal variability has led to the definition of standard parameters: 10-minute average value (and 2 minutes for local aeronautical use), gusts defined as extreme values over a period of 3 s measured over the previous 10 minutes. The sampling frequency for measurements recommended by the WMO is 4 Hz and should not fall below 1 Hz.
The surface wind is measured at a conventional height of 10 m, which is in fact a compromise between a height sufficient to minimize the effect of buildings or nearby vegetation and the need not to impose excessive installation and access constraints. The clearance rules are very restrictive, the ideal (class 1 OMM) being an installation at a distance of at least 30 times the height of the surrounding obstacles.
– Rotary anemometers
The most common instruments are still cup or propeller anemometers. They now have an optical transducer to count the number of revolutions and fractions of revolutions. Their response is determined by the shape of the cups and therefore does not necessarily require initial or periodic calibration. However, to measure light winds, ball bearings must be maintained or regularly changed, to ensure a sufficiently low starting threshold (typically between 0.5 and 1 m/s). They are associated with a weather vane, whose flag is oriented in the wind bed.
– Ultrasonic anemometers
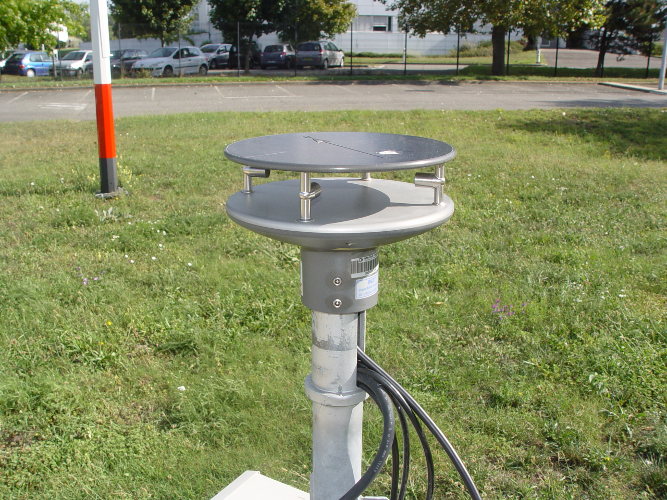
These static sensors require little maintenance and servicing. They can be heated more easily than rotating anemometers for icing or freezing conditions. Some models are disturbed by birds, which peck at the transmitters or settle between the sensor rods, blocking the sound beams. Some models (Figure 7) do not have this disadvantage, but are more difficult to heat up in icing conditions.
7. Precipitation measurement
– Rain Gauges
The simplest rain gauges are graduated containers that collect water and require manual reading. For automatic measurements, the most common rain gauges use tipping buckets, placed under a collection cone, which switch alternately when filled. The resolution of the measurement is then given by the collection surface and the mass of water tilting a bucket, for example 0.2 mm for a 20 g bucket and a 1000 cm² surface. The simplicity and cost of this technique make them the most widely used rain gauges for automatic measurements. For the measurement of solid precipitation a heating is necessary, but it increases the capture deficit!
There are also rain gauges that weigh the mass of a collection pot, which can also measure solid precipitation with brine in the pot. A large pot capacity is required to avoid overflows, but these devices can be more accurate and have a better resolution than rain gauges with buckets.
– Snow height measurement
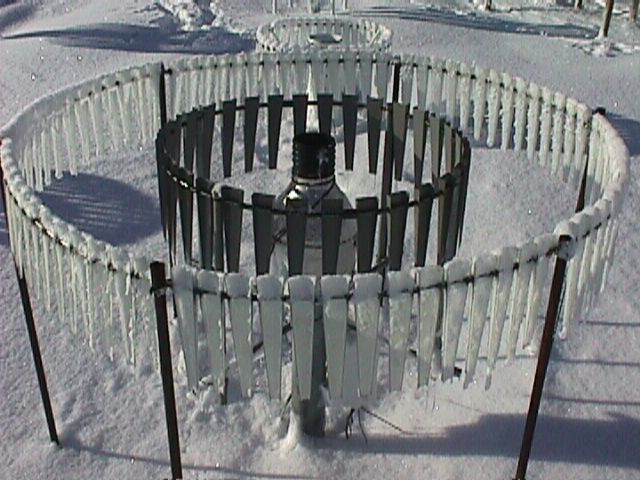
The water level equivalent to a snowfall is typically measured by a heated rain gauge, with a large underestimation in the absence of a wind screen. There are also snow height sensors, either ultrasonic (measurement of the round trip time of a sound wave reflected on the snow surface) or using a laser (measurement of distance by phase shift of a laser beam modulated at several frequencies). Their resolution/incertitude is in the order of cm.
– Optical sensors
8. Radiation and sunshine
In meteorology, the most traditional measurements of sunshine are as follows.
- The measurement of global solar radiation on a horizontal plane, in a wavelength range from 0.3 mm to 3 mm, is carried out using a pyranometer, a device that uses a thermopile between the receiving surface of a black body and the body of the device.
- Direct solar radiation is measured with a pyrheliometer, which also uses a thermopile, but continuously oriented in the direction of the sun.
- The exposure time is defined and measured as the time during which the direct solar radiation is greater than 120 W.m-2.
- Thermal radiation from the sky is measured with a pyrgéometer, whose thermopile is protected by a dish that is opaque to solar radiation and transparent to infrared radiation of long wavelengths (> 3.5 mm).
- Some measurements of solar UV radiation are sometimes made with a specific UV pyranometer.
9. Visibility measurement
The OMM defines visibility as the greatest distance at which a black object of appropriate size can be seen and identified during daylight hours on the background of the sky on the horizon. In the case of night observations, this is the distance at which this object could be seen and identified if the general illumination increased until it reached normal daylight intensity. This visibility is also called the Meteorological Optical Range (MOP). It is related to the air extinction coefficient σ by the formula POM = 3/σ, deduced from the Koschmieder relationship [10] with a conventional contrast ratio of 5%.
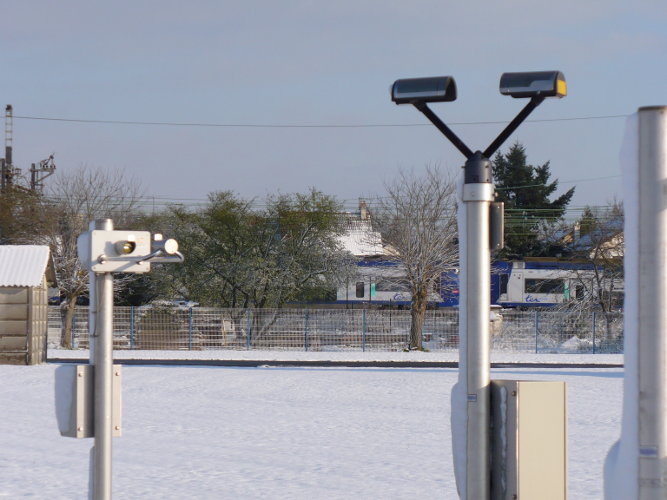
The air extinction coefficient, or POM, is measured mainly by scatterometers (Figure 11), which measure the lateral diffusion of light emitted by the sensor into a small volume of air in front of the sensor. Their range ranges from a few meters to more than 10 km (up to 60 km or more!), with an uncertainty of about 10 to 20% of the measured value.
10. Cloud altitude and extent
Algorithms are used to combine observations from one or more cloud rangefinders to determine the extent and height of cloud layers over a site. These algorithms assume that the movement of clouds over the sensor allows their extent to be estimated. Observations over the last 30 minutes are used for the calculation.
11. Observation of the nature of precipitation
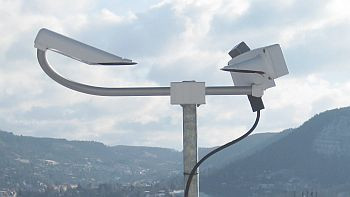
A sensor used by Météo-France (Figure 13) uses optical particle detection with a scatterometer (also used for visibility) and an estimate of the amount of water deposited on a capacitive sensor. The combination of these signals allows the sensor to provide a diagnosis on the type of precipitation and its intensity. The direct output signal from this type of sensor is rarely used as is by weather services. To make the diagnosis more reliable and/or refined, it is combined with the measurement of other meteorological parameters (air temperature and humidity, ground level temperature, presence of clouds, etc.), with complex algorithms that are often the exclusive property of the weather services.
12. Automatic stations and data concentration
The various sensors of an observation station are connected to a data acquisition system, commonly referred to as an “automatic station”. When the configuration allows it, this station is powered by a solar panel; otherwise, a connection to the electrical mains is required, in particular to heat certain collectors and/or in the presence of complex collectors whose consumption is not compatible with solar panels. The data acquisition time step is typically one minute.
The availability of telecommunications facilities and the reduction in their costs now allow for real-time data transmission. The latest generation of stations allows a transmission every minute. The GPRS or 3G cellular network is widely used. For isolated sites, satellite transmissions are used. Their flow limitation and cost require local data processing by the station, to transmit data processed over a period of one hour, with cumulative and extreme values.
This data is concentrated on a national scale and is now processed centrally rather than locally, to facilitate system maintenance and scalability, to control its quality and to obtain accumulations and extremes. Standard messages are then coded for broadcast on the WMO telecommunication system and used by other countries.
13. Messages to remember
- Determining the initial state of the atmosphere requires measuring a large number of physical quantities from the ground (air temperature and humidity, wind speed, etc.) and characterizing more qualitative data such as the visibility and size of cloud masses.
- Ground-based measuring stations form a dense network at various scales and are increasingly automated. However, some human interventions are still being used, such as to facilitate the collection of real-time observations using applications available on smartphones.
- The uncertainty of measurements, the maintenance of stations, their automation and the centralization of real-time data are major requirements, since they determine the quality of the first ingredient of weather forecasting, the initial state of the atmosphere, from which the calculation of its evolution is launched.
Notes and references
Cover image. Sensor under test for measuring the present time (visibility and type of precipitation). [© Michel Leroy]
[1] WMO-No. 8, also known as the CIMO Guide. http://www.wmo.int/pages/prog/www/IMOP/CIMO-Guide.html
[2] In most cases, a local observation is combined with all the observations in the region to obtain a “picture” of the state of the atmosphere at a given time. Aerodrome observations are directly used by controllers and pilots, in real time, for landing and take-off.
[3] This participatory observation is accessible by any user of the Météo-France application, intended for smartphones.
[4] This classification of the measurement environment is described in Appendix 1D of Chapter 1 of the CIMO Guide, cited above.
[5] Still called thermistors, these sensors have the property of having an electrical resistance that depends linearly on temperature, at least within a certain range of variation; they are manufactured to follow a standardized resistance-temperature relationship.
[6] Richard Assmann, a German meteorologist, invented a psychrometer with forced ventilation using a mechanical spring fan before the 1900s. Metal tubes protect dry and wet thermometers from radiation. Such a psychrometer is still a reference instrument for spot measurements. See for example: http://www.nandagroup.com/pdfmine/assman.pdf
[7] The dew point temperature is lower than the air temperature, it is equal to 100% relative humidity. The lower the relative humidity, the greater the difference between air temperature and dew point temperature.
[8] The Peltier effect is a thermoelectric effect consisting of a heat displacement in the presence of electrical current at the junction between 2 conductive materials of different nature.
[9] A disdrometer is a sensor that measures the distribution of droplet size and droplet rate.
[10] In 1924, Koschmieder established a relationship (which later became Koschmieder’s Law) between the apparent contrast Cx of an object seen on the horizon by a distant observer, and its inherent contrast C0, that is, the contrast that would be that of that object against the horizon if it were seen at a very short distance. Koschmieder’s relationship can be written as: Cx = C0 e-σx
1[1] The candela is the unit of light intensity perceived by the human eye.
[12] Laser remote sensing or Lidar, or Light detection and ranging, is a remote measurement technique based on the analysis of the properties of a beam of light reflected back to its transmitter.
[13] Highest ice clouds, between 6 and 14 km above sea level.
The Encyclopedia of the Environment by the Association des Encyclopédies de l'Environnement et de l'Énergie (www.a3e.fr), contractually linked to the University of Grenoble Alpes and Grenoble INP, and sponsored by the French Academy of Sciences.
To cite this article: LEROY Michel (January 5, 2025), Ground weather observations: what is measured and what is done with it?, Encyclopedia of the Environment, Accessed March 14, 2025 [online ISSN 2555-0950] url : https://www.encyclopedie-environnement.org/en/air-en/ground-weather-observations-what-is-measured-and-what-is-done-with-it-2/.
The articles in the Encyclopedia of the Environment are made available under the terms of the Creative Commons BY-NC-SA license, which authorizes reproduction subject to: citing the source, not making commercial use of them, sharing identical initial conditions, reproducing at each reuse or distribution the mention of this Creative Commons BY-NC-SA license.