A carbon cycle disrupted by human activities

PDF
Encyclopédie environnement - carbone - couverture

All living beings are built from carbon atoms. These are extracted from atmospheric CO2 by plants, algae and certain bacteria, using solar energy: this is photosynthesis. The respiration and decomposition of living beings release this CO2 back into the atmosphere. In addition to this short life cycle, there is a slow geological cycle that stores carbon in the form of limestone and fossil hydrocarbons. Limestone comes from the shells of marine organisms while hydrocarbons are formed by burial of organic sediments. The combustion of fossil resources currently represents a short circuit from this slow cycle to the short cycle that largely dominates natural regeneration processes. This leads to a rapid accumulation of CO2 in the atmosphere, causing global warming, and ocean acidification that can disrupt marine life.

1. The origins

Carbon is a fairly abundant element produced -like most light elements in the core of stars- by nuclear fusion of hydrogen (see Nuclear Energy). The carbon on Earth and the other planets comes from a star that exploded before the formation of the Solar System. During such an explosion (supernova) the condensable matter formed clouds of gas and dust which then aggregated to form planets in the early Solar Nebula. Like all non-radioactive elements [1], this initial carbon is permanently conserved and recycled since the formation of the Earth, passing through different environments and combining with different molecules.

This primitive material, prior to the formation of the Earth, has reached us almost intact in some meteorites called carbonaceous chondrites. It is also found in comets. Remarkably, carbon forms various elementary organic chemical compounds, such as hydrocarbons, alcohols and amino acids (see How to study the organic molecules of comets). Giant planets like Jupiter or Saturn are composed mainly of hydrogen (90%) and helium (nearly 10%), but carbon is also present (0.1%) in the form of methane (CH4) or other hydrocarbons.

On rocky planets like the Earth, the high temperatures during their formation have led to the separation of the metallic elements (iron and nickel) that form the core of the less dense silicates that make up the mantle. It is estimated that carbon has been distributed in comparable proportions between nucleus [2] and mantle. In the latter, pure carbon subjected to high pressure and temperature crystallizes into diamonds: they are found on the surface in former highly active volcanic pipes, where rapid cooling has blocked any change in state. However, it is mainly present in the form of carbonates constituting between 0.003 and 0.03% of the mass of the mantle. It is released into the atmosphere as carbon dioxide, CO2, during volcanic eruptions. On Mars and Venus, volcanism also emits CO2, which is the main component of the atmosphere. CO2 was also one of the main components of the Earth’s atmosphere before photosynthesis appeared, which released oxygen while fixing atmospheric carbon as organic matter (see The biosphere, a major geological player).

2. Earth carbon reservoirs

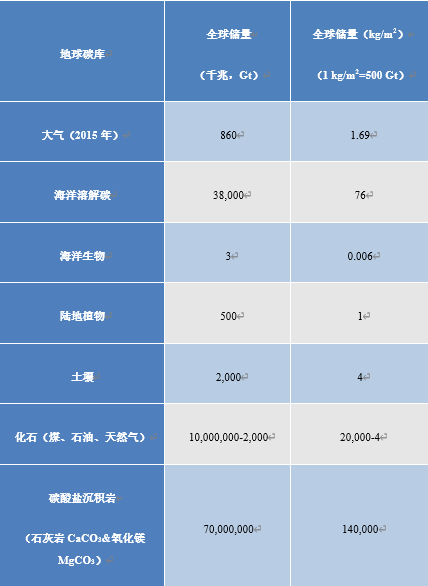
Carbon is stored in different forms in media called reservoirs, the main ones are listed in Table 1. These reserves are expressed in gigatonnes of carbon (1GtC = 1012 kg of carbon). More intuitively, these quantities can be reported on the total surface area of the globe (510 million km2 or 510 x 1012 m2), so that 1 kg/m2 corresponds to a total of 510 GtC. The atmosphere currently contains 1.69 kg/m2 of carbon in the form of CO2 well mixed by the winds. This quantity can easily be deduced [3] from the atmospheric CO2 concentration, currently 400 ppmv (one ppmv indicates a proportion of 10-6 by volume, or the number of molecules). And a 1 ppmv increase corresponds to 2.12 GtC.

The ocean contains nearly 50 times more carbon than the atmospheric reservoir. The dissolved CO2 reacts with water to give carbonic acid H2CO3, itself in equilibrium with the hydrogen carbonate ion HCO3 (also called bicarbonate) and the carbonate ion CO32-. The HCO3 form represents nearly 95% of ocean carbon. The ocean-atmosphere exchange transfers CO2 either in one direction (atmosphere to ocean) or in the other (ocean to atmosphere), tending towards a temperature-dependent balance of concentration ratios.

The total mass of living oceanic organisms (called ocean biomass) contains a more limited amount of carbon, 6 g/m2, mainly in the form of plankton and bacteria. Terrestrial vegetation represents 1 kg/m2 of carbon, while 4 kg/m2 is stored in the organic debris of the soil (constituting humus). These are averages relative to the total surface area of the globe.

Table 1. Carbon reservoirs (mantle and terrestrial core are not mentioned due to high uncertainties and limited interactions with the environment).

Encyclopédie environnement - carbone -roches cacaires Everest
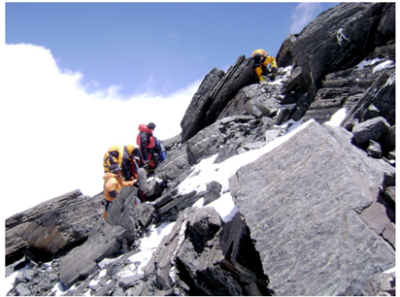
Figure 1. Limestone rocks near the summit of Mt Everest, formed by shells of marine organisms 500 million years ago [Source: Conrad Anker, http://www.montana.edu/everest/resources/pdf/GearActivity/RocksofEverest.pdf].
However, a larger carbon reservoir is found in calcareous rocks, formed of calcium carbonate (CaCO3), combined with magnesium in variable proportions. The total mass of carbon immobilized in this way is estimated at about 140 t/m2. As the mass of carbon represents 12% of the limestone, this represents about 1000 t/m2 of limestone, an average thickness of about 500 m. Limestone is a major geological formation such as the Paris Basin (especially in the form of chalk), the Colorado Grand Canyon, or large mountain ranges. They can be found as far as the summit of Mount Everest (Figure 1).

Another part of the carbon, estimated at 20 t/m2, is stored as fossil carbon of organic origin (unoxidized). This carbon is found mainly in sediments and sedimentary rocks, in very low concentrations (kerogens). A small portion evolves into methane (CH4), which can be trapped on the ocean floor and in frozen soils as hydrates. Only a small fraction of the fossil carbon (less than 0.01%) has been concentrated, matured and sequestered to produce exploitable deposits of hydrocarbons (gas and oil) and coal (see Oil: evidences for its biological origin).

At time scales of hundreds of millions of years, sediments are carried away by tectonic plate movements and partially integrate into the mantle, whose total carbon reserve, very poorly known, is estimated to be even higher than that of limestone rocks.

3. Flows disrupted by human activity

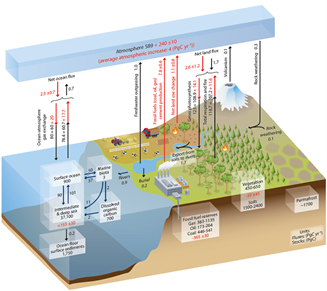
The carbon flows between the different reservoirs are illustrated in Figure 2 (taken from [4]) which distinguishes between the pre-industrial situation and subsequent changes (red numbers). The first is the combustion of fossil fuels reserves, which produced 7.8 GtC/year in the decade 2000, taken as a reference for these data. The other numbers in red correspond to the system reactions that will be discussed in section 4.

Encyclopédie environnement - carbone - stocks carbone sur Terre
Figure 2. Representation of estimated carbon stocks on Earth that could support trade at the century scale (excluding limestone rocks), and annual carbon flows, in billions of tonnes of carbon (or petagrams, 1 PgC = 1 GtC). Black flows represent equilibrium “natural” trade, i. e. those that were the only ones that existed before the beginning of the industrial era, and black values for stocks represent the (reconstituted) state of 1750, before the beginning of industrial activities. Red flows represent the effect of human activities (increased, decreased or created), for the average of the decade 2000-2009, and red values for stocks represent the change from 1750 to 2011. [Source IPCC 2013, ref [4].]
CO2 is permanently exchanged between the atmosphere and the surface ocean, by dissolution or degassing. Degassing is dominant in equatorial regions, where CO2-rich deep water rises and warms, and dominant dissolution in polar regions, due to surface water cooling. At mid-latitudes, seasonal temperature variations control the direction of exchanges. The two effects, dissolution and degassing, are approximately balanced on average with an overall flow of about 80 GtC/year in each direction.

The most important flow is related to photosynthesisBioenergetic process that allows plants, algae and some bacteria to synthesize organic matter from CO2 in the atmosphere using sunlight. Solar energy is used to oxidize water and reduce carbon dioxide in order to synthesize organic substances (carbohydrates). The oxidation of water leads to the formation of O2 oxygen found in the atmosphere. Photosynthesis is the basis of autotrophy, it is the result of the integrated functioning of the chloroplast within the cell and organism. of terrestrial vegetation, capturing about 100 GtC/year, theoretically able to extract all CO2 from the atmosphere in less than a decade. This is also known as primary production, which supplies organic matter to the entire earth’s life. This flow is almost exactly compensated by the CO2 emissions due to the breathingThis refers both to the gaseous exchanges resulting from the inhalation and exhalation of air by living organisms (CO2 carbon dioxide release and O2 oxygen absorption) and to cellular respiration which, by degrading glucose with oxygen, allows energy to be obtained., including that of the plants themselves and the bacteria that break down organic matter, as well as fires (e.g. forest fires); (read Peatlands and marshes, remarkable wetlands).

Encyclopédie environnement - carbone - distribtuion biosphère sur Terre
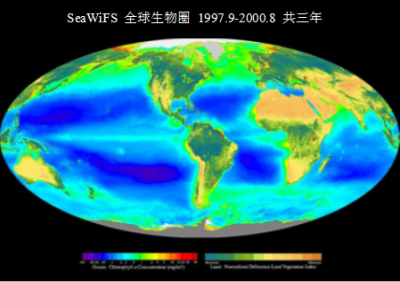
Figure 3. Distribution of the biosphere on Earth. Combination of views taken over 8 years by the SeaWiFS instrument on board the OrbView-2 spacecraft. The colours represent (a) marine surfaces: quantity of chlorophyll (in mg/m3, representing planktonic biomass, left-hand coloured scale), (b) land surfaces: vegetation index (right-hand coloured scale). [Source: NOAA].
The ocean is also an important medium for primary photosynthetic production, mainly by microorganisms that constitute what is called phytoplankton: microalgae (including diatoms), cyanobacteria,… Satellites have provided accurate knowledge of population concentration, distribution and renewal rates and have provided credible estimates of primary production in the oceans. Observation of the chlorophyll content of the oceans (Figure 3) shows that areas between the 40th and 60th parallels in the North and South of the planet are richer than tropical areas (with the exception of the outlet of large rivers such as the nutrient-rich Amazon). It is possible to estimate primary oceanic production from such chlorophyll concentration observations, leading to an overall figure of 50 GtC per year, or about 50% of terrestrial production. It is remarkable that the carbon stored in marine life is nearly 200 times lower than that in terrestrial environments (3 GtC versus 500 GtC). Phytoplankton that dominate marine biomass store little carbon due to their short life span, unlike trees that dominate terrestrial biomass.

This primary production varies greatly in the ocean, regionally and seasonally, as phytoplankton are extremely sensitive to environmental fluctuations. Thus, the phosphate and nitrate richness of some waters (e.g. at the mouths of some rivers) locally fertilizes the surface layer of the ocean and leads to explosions in planktonic productivity (we speak of plankton blooms). This increase in photosynthesis reduces the CO2 content of surface water, which is compensated by a dissolution of atmospheric CO2. Phytoplankton and algae are grazed by consumer organisms (zooplankton, fish, molluscs) that regenerate most of the CO2 through their respiration and decomposition.

In addition, dead organisms or faecal particles carry organic carbon deep down where they feed living organisms (called heterotrophs) that remain dependent on surface photosynthesis. However, there is a notable exception near volcanic fumaroles where life is maintained by chemosynthesis, a reaction similar to photosynthesis where solar energy is replaced by the chemical energy of hydrogen sulphide (see Microbes in extreme environments and the focus on Black smokers’ ecosystems).

Only a small proportion of the marine organic carbon produced at the surface, about 0.2 GtC per year, accumulates in ocean sediments and slowly decomposes there without oxygen, forming hydrocarbons on a scale of millions of years. Coal is of terrestrial origin, its production began with the appearance of the first large trees during the Carboniferous era, 300 to 350 million years ago (see The biosphere, a major geological player).

Carbonated shells of marine organisms sediment and dissolve at great depth under pressure, releasing carbonate ions. This dissolution enriches deep waters with carbonates, such as sedimentation and recycling of organic particles (“biological pump”). In contrast, in shallow basins, these shells accumulate and slowly form limestone that is entrained in geological processes. Together with organic sediments, they are the only oceanic carbon sinks for the ocean-atmosphere system. In return, a CO2 flux of about 0.1 GtC/year is re-emitted by volcanoes into the atmosphere.

The dissolution (alteration) of the limestone supplies the ocean with carbonates for 0.1 Gt/year (this dissolution, as well as that of silicates, also results in atmospheric CO2 dissolved in rainwater for a total of 0.3 GtC/year). This carbon passes through rivers, joining that caused by soil erosion. The ocean receives 0.9 GtC/year from rivers, but this input is almost compensated by an estimated 0.7 GtC/year of ocean degassing in the pre-industrial situation.

These exchanges between atmosphere, rocks and living beings have played a considerable role in the ancient history of the Earth (see The biosphere, a major geological player), leading to significant variations in atmospheric composition and climate. However, these natural geological flows remain low: they are typically a thousand times lower than those of photosynthesis and nearly a hundred times lower than those of fossil fuel combustion. Over the past century, it is human activities that control the transformations of our environment.

4. The accumulation of CO2 over the last century

Encyclopédie environnement - carbone - production annuelle c02 combustion fossile
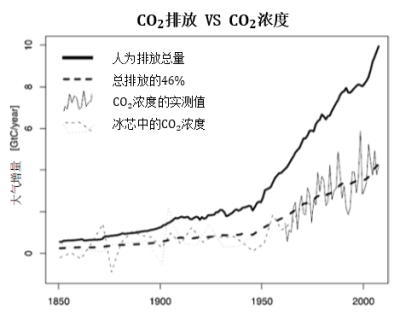
Figure 4. Annual production of CO2 by burning fossil resources and changes in land use (deforestation) since the beginning of the industrial era, compared to the annual increase in measured atmospheric CO2 (both expressed in Gt of carbon). This comparison shows that only half (46%) of the CO2 emitted accumulates in the atmosphere. Concentration measurements prior to 1960 are obtained from bubbles trapped in ice. [Source W. Knorr, 2009, ref. [5]]
There has been a rapid increase in atmospheric CO2 content since the beginning of the industrial era, following an increase from a level that remained almost constant at around 280 ppmv for at least the previous thousand years. Not only is the atmospheric content increasing, but its rate of increase is also accelerating, as shown in Figure 4. This rate is currently about 4 GtC (or 2 ppmv) per year. If it remained constant, such a rate would increase the atmospheric content of the current value from 400 ppmv to 560 ppmv over 80 years, twice the pre-industrial value. This rate of increase is well correlated with emissions from human activities, as shown in Figure 4, mainly from the combustion of fossil resources (coal, oil and gas), but also includes deforestation and the production of cement that releases carbon from limestone (3% of CO2 emissions). However, the total increase in atmospheric CO2 remains half of the accumulation of these anthropogenic emissions, indicating that the other half is being reabsorbed, as we will see below.

This accumulation of atmospheric CO2 induces global warming by increasing the greenhouse effect (radiation and climate link). It is also accompanied by ocean acidification that affects marine organisms.

The major contribution of fossil fuel combustion to the increase in atmospheric CO2 is confirmed by the isotopic composition of CO2 carbon (see Radioactivity and nuclear reactions). Carbon consists mainly of the isotope 12C (containing 6 neutrons in addition to the 6 protons), but also of a small proportion of 13C (7 neutrons) and 14C (8 neutrons). Photosynthesis captures 13C less efficiently than 12C so that biologically derived carbon has a lower isotopic ratio of 13C/12C than mineral carbon emitted by volcanoes. However, we observe that the isotopic ratio 13C/12C of atmospheric CO2 decreases, which marks its biological origin.

14C is produced by the nuclear reaction of cosmic radiation on nitrogen in the upper atmosphere, then integrated into CO2 and captured during photosynthesis, so that it is incorporated into all living beings in known proportions (10-12). As it is radioactive, its concentration decreases with a half-life of 5730 years (this is what is used for dating biological remains). It has therefore completely disappeared into much older fossil fuels.

However, there is a decrease in the atmospheric 14C concentration (after adjusting for the contributions of the nuclear explosions of the 1960s, which doubled the 14C concentration). This shows that the increase in CO2 comes from fossil biological sources [6] rather than from current biological sources.

Encyclopédie environnement - carbone - décroissance oxygène atmosphérique
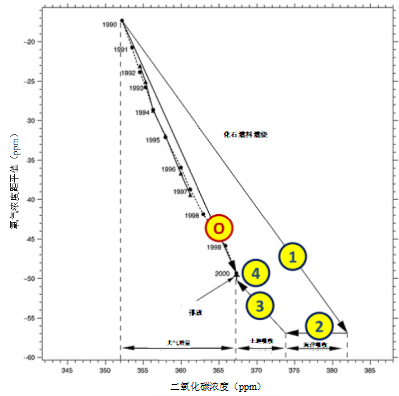
Figure 5. Decrease in atmospheric O2 oxygen content as a function of the increase in CO2 content during the 1990s (arrow 0). The arrow (1) represents the contribution of fossil fuel combustion, combining CO2 increase and O2 decrease in known proportions. The arrow (2) represents the dissolution in the ocean that reduces atmospheric CO2 without variation of O2, while the arrow (3) represents photosynthesis, which decreases CO2 by releasing O2 in equal proportion. Finally, the ocean releases a small part of its dissolved oxygen, so there is no variation in CO2 (arrow 4). [Source: IPCC Report 2001 (See ref [7])].
In addition, the combustion of fossil resources consumes oxygen. The resulting decrease in atmospheric O2 concentration remains small but quite measurable. This decrease is shown in Figure 5 as a function of the increase in CO2 concentration measured during the 1990s (15 ppmv in ten years). The measured increase in CO2 is about half of that expected from the combustion of fossil resources (arrow 1). O2 consumption is also lower, but not in the same proportion. These results make it possible to identify and evaluate two causes of absorption of the CO2 emitted: dissolution in the ocean (arrow 2), which does not change the concentration of O2, and photosynthesis, which releases O2 in the same proportion as it reduces CO2 (arrow 3). A final, very limited effect corresponding to the degassing of dissolved oxygen due to ocean warming (arrow 4). In summary, of the 30 ppmv produced by fossil fuels in the 1990s, Figure 5 shows that 8 ppmv dissolved in the ocean, 7 ppmv were recycled by photosynthesis, while the remaining 15 ppmv accumulated in the atmosphere.

Over the decade 2000 shown in Figure 2, these figures translated into GtC (1 ppmv for 2.12 GtC, see section 2), increased to 7.8 GtC per year produced by fossil fuels, of which 2.3 GtC dissolved in the ocean and 1.5 GtC recycled by photosynthesis. The remainder, 4 GtC per year, has accumulated in the atmosphere.

In addition to CO2, carbon is also emitted into the atmosphere in the form of methane by anaerobic fermentation (away from the air) and by leaks from oil or gas fields. Although 200 times less concentrated than CO2, its contribution to the increase in the greenhouse effect is 25% of that of CO2 [4]. Its impact on the greenhouse effect is about 25 times more powerful than CO2 and its concentration in the atmosphere has increased by a factor of 2.5 compared to the pre-industrial situation. A sudden release of methane from frozen soils or marine sediments could accelerate global warming. However, the methane emitted into the atmosphere only persists for about ten years because it is slowly oxidized to CO2. Carbon is finally emitted in many other forms by human activities, in particular plastics produced at a rate of 0.3 Gt per year, of which an estimated one-tenth reaches the ocean and accumulates in the heart of vast eddies called gyres (see Plastic pollution at sea: the seventh continent).

5. Dissolution in the ocean

CO2 dissolves in the surface ocean, tending to reach a concentration of equilibrium proportional to its partial pressure in the atmosphere. This is a general property of gas solubility called Henry’s Law. This is why the dissolved CO2 escapes when you open a bottle of champagne, following the drop in pressure. This degassing is increased by an increase in temperature, which reduces solubility. CO2 thus escapes into the atmosphere in the warm tropical ocean, and on the contrary dissolves in the polar regions, the overall balance being neutral in a stationary regime. Global warming, on the other hand, induces global degassing. In the current period, however, it is the dissolution induced by the increase in atmospheric CO2 that dominates.

The surface ocean currently contains mineral carbon at 24 ppm by mass [9] (24 g per tonne of water). If we take the total mass of the ocean, 1.4 x 10¹⁸ tonnes, this would represent a reserve of 33 x 1018 g of carbon, or 33,000 GtC. The reserve is estimated at 38,000 GtC because the concentration is a little higher at depth. At equilibrium, the concentration of dissolved CO2 increases in proportion to its atmospheric pressure, in accordance with Henry’s law, but 95% of the dissolved carbon is in the form of carbonate and hydrogen carbonate ions. Thus the relative increase in dissolved carbon is only about 1/10 [10] of the relative increase in atmospheric CO2: an annual increase in this CO2 of 2 ppmv over 400 ppmv, or 0.5%, therefore implies a 10 times smaller increase in dissolved carbon, or 0.05% of 24 ppm, giving 0.012 ppm. This carbon is only absorbed by the surface ocean: if it were absorbed by the entire ocean, the flux would be 17 GtC per year, whereas it is estimated at 2.3 GtC/year (Figure 2). The absorbed CO2 is only transferred very slowly at depth.

Encyclopédie environnement - carbone - accumulation co2 atmosphère
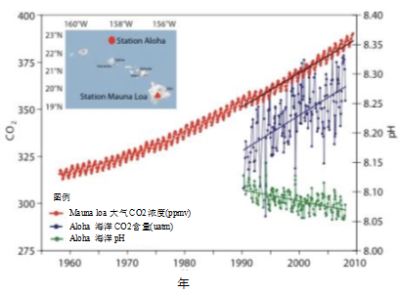
Figure 6. CO2 content of the atmosphere (expressed in ppmv equivalent to 10-6 atmosphere of partial pressure), and in surface water in the Hawaii Islands (expressed in equilibrium partial pressure with the same unit). The acidity of the water (pH) is also represented (green curve, right scale). The annual oscillations of atmospheric CO2 are due to seasonal variations in photosynthesis and terrestrial respiration. Fluctuations in the ocean are greater because the mixing is much less effective than in the atmosphere, but the trend is confirmed by averages at many ocean sites. [Source: Oceanography, see ref. [9]].
Rather than the dissolved carbon concentration, oceanographers often prefer to measure the equilibrium pressure of CO2 in water. This is obtained by allowing a seawater sample to degas in an air volume small enough not to affect its concentration in the water. If this equilibrium pressure is higher than the partial pressure of CO2 in the atmosphere, dissolved CO2 will escape to restore the equilibrium, otherwise, on the contrary, atmospheric CO2 will be dissolved. Figure 6 shows that this equilibrium pressure remains close to the partial pressure of atmospheric CO2 and increases concomitantly, confirming the equilibrium of the surface ocean with atmospheric CO2.

In addition, the dissolution of CO2 releases H+ ions by reaction with water, which corresponds to an increase in acidity. This is measured by the pH, which is even smaller when the solution is acidic. This decrease is clearly visible in Figure 6. Acidification tends to limit the synthesis of the coral’s calcareous skeleton, in a variable way depending on the species [11].

However, this dissolution equilibrium is limited to the ocean in direct contact with the atmosphere, a layer of a few hundred metres thick stirred by the wind. The deep ocean remains unaffected by stratification: warmer and therefore less dense water floats on the surface. Surface water penetrates deep only sporadically and very locally into the polar regions where, after concentration of salt by evaporation, it can exceed the density of the bottom due to its cooling. It is estimated that 50 x 106 m3/s is the surface water flow that feeds the deep ocean, compensated of course by an equivalent global flow of deep water rising to the surface (the total mass of the ocean remaining unchanged). This represents 1.5 x 10¹⁵ tonnes per year, and the renewal of the deep ocean, 1.4 x 10¹⁸ tonnes, takes place in about 1000 years.

Thus, each year, 1.5 x 10¹⁵ tonnes of water in equilibrium with the current CO2 concentration (380 ppmv for the decade 2000) is replaced by deep water in equilibrium with the pre-industrial concentration of 280 ppmv, i.e. 30% lower. As we have seen, this represents a difference of 10 times less dissolved carbon, i.e. 3% or 0.7 ppm. Multiplying by the total water flow, we obtain a well of 1 GtC/year buried towards the deep ocean.

In addition, we have seen that the concentration of dissolved carbon increases by 0.012 ppm per year in the surface ocean, in a sufficiently stirred layer to homogenize over the decade. By choosing as an indication a thickness of 300 m for this mixed layer (note: this layer is thicker than the “surface ocean” in Figure 2 which is limited to the area of light penetration allowing photosynthesis) over the entire ocean surface, 0.36 x 10¹⁵m2, the mass of water concerned is 1.1 x 10¹⁷ tonnes, which leads to an annual stored carbon mass of 1.3 GtC/year in this mixed layer. Adding what is discharged to the deep ocean, 1 GtC/year, we find the 2.3 GtC/year deduced from atmospheric observations for the decade 2000. This global value of the absorbed flux is also confirmed by a mapping of the CO2 fluxes measured between the atmosphere and the ocean [8].

This flux must increase in proportion to the atmospheric CO2 concentration as long as warming does not affect ocean currents. However, this purely physical assessment is very schematic. It assumes constant flows of biological origin, linked to sedimentation and dissolution processes, which play a key role in the vertical mixing of dissolved carbon, with a flow of 11 GtC/year.

6. The influence of vegetation

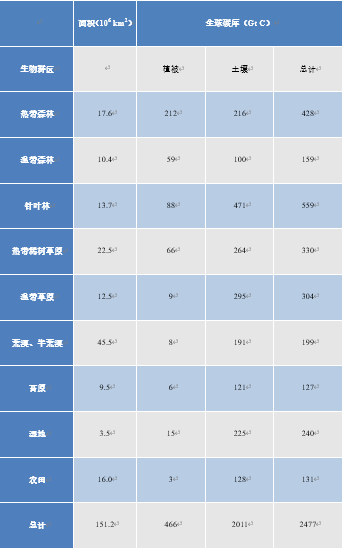
Terrestrial vegetation plays a key role in CO2 fluxes, as well as in the storage of carbon in the form of visible vegetation, but also in the form of humus in the soil. Thus grasslands, savannahs and even semi-desert regions contribute significantly to the overall stock, although their vegetation content is low, see Table 2 (see Peatlands and marshes, remarkable wetlands). It also shows that boreal forests store a large amount of carbon in the soil, while tropical forests have very abundant vegetation but soil that is not very capable of storing carbon.

Table 2. Overall carbon reserves in vegetation and upper (1 m) soil (Adapted from IPCC, 2001 [12]).

CO2 emissions from deforestation are now estimated at 1.1 GtC per year [13], contributing 25% to the rate of increase in greenhouse gases in the atmosphere. Deforestation has several origins: forest exploitation, the need for space for urban expansion, the conversion of forests into agricultural land, mining. For example, the boreal forest is destroyed over an area of 3,400 km2 by open-pit mining of the Athabasca oil sands (Alberta, Canada) [14]. Biofuel production by large scale agriculture is also devastating, promoting the development of monocultures, such as soya in the Amazon and  palm oil in Indonesia, Malaysia and Thailand.

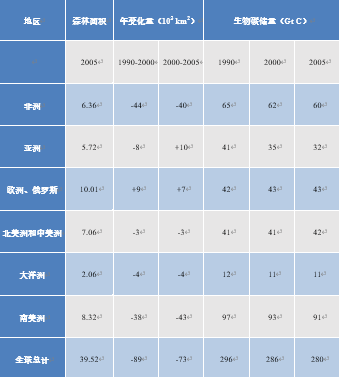
The rate of deforestation in tropical forests is of particular concern from both an ecological and a climatic point of view. It reaches 10,000 to 30,000 km2 per year in the Amazon [15], 5% of the forest area per decade in South America, with similar values in Africa (see Table 3). In Southeast Asia, fires encouraged by the El Nino climate phenomenon are helping to reduce forest cover. In 1997, forest and peatland fires in Indonesia released between 0.8 and 2.5 GtC of CO2 into the atmosphere [16]. Stabilization of forest areas in Asia includes massive destruction of primary forests and their replacement by planted forests, resulting in a reduction of nearly a quarter of the carbon stored by vegetation in 15 years (Table 3): from 12-74 kg/m2 in forests to 8.5-29 kg/m2 in oil palm plantations [17].

Table 3. Global deforestation in figures (Adapted from IPCC, 2007 [18]).

On the other hand, forests are spreading to other parts of the world, offsetting some of the deforestation. Inventories increased in Europe, North America and Oceania. In the mid-2000s, the overall net deforestation rate was about 70,000 km2 per year, slightly lower than the rate of about 90,000 km2 per year that prevailed [16] in the 1990s. This represents a relative loss of surface area of 2% per decade, and even more a loss of stored carbon of 3%, corresponding to 1.1 GtC per year (see Table 3).

However, the atmospheric balance of CO2 and oxygen (see Figure 5) indicates that photosynthesis absorbs 1.5 GtC per year overall. The 1.1 GtC carbon source due to forest destruction is therefore more than offset by a 2.6 GtC carbon sink per year. This “missing carbon” is probably captured in soils where the overall measurement is even more difficult than for vegetation. Several factors can lead to an increase in photosynthesis. It is known that increasing atmospheric CO2 concentration promotes photosynthesis if other environmental factors are favourable. The spread of nitrogen fertilizers and global warming could also encourage plant activity leading to increased storage of organic matter in the soil. The ocean could also contribute to this carbon sink, which would imply an increase in sedimentation from the estimate of 0.2 GtC per year shown in Figure 2, which corresponds to an average observed on older sediments.

7. The prospects for remediation of anthropogenic carbon emissions

As we have seen, the burning of fossil resources and deforestation lead to an accelerated accumulation of CO2 in the atmosphere, a source of global warming and ocean acidification. Only 50% of these flows are reabsorbed by natural feedbacks. A reduction of at least 50% in emissions is thus necessary to hopefully stabilize the CO2 concentration.

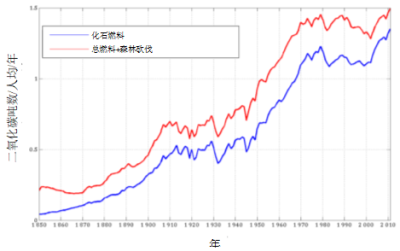
Figure 7. Evolution of annual CO2 emissions per inhabitant (expressed in tonnes of carbon). Emissions from the combustion of fossil resources and cement production are given by the blue curve (data http://cdiac.ornl.gov/) while the red curve adds the effect of deforestation. [Source: Estimates provided by R. Houghton, corresponding to ref. [12].]
The increase in carbon emissions is primarily related to the increase in world population, which has increased fourfold in a century (7.4 billion inhabitants in 2016 compared to about 1.8 billion in 1916). Per capita emissions have also increased overall by a factor of two over the same period, see Figure 7. The necessary reduction by a factor of two of emissions, in a context of high population growth, therefore requires a major change in technologies and consumption habits.

The per capita emission curve shows an inflection in the years 1970-2000 following the oil shock, the development of nuclear energy, and the decline of heavy industry (notably through the fall of the USSR). But there was a further increase in the 2000s following the massive use of coal, whose consumption increased by 50% in 10 years. It currently accounts for 30% of primary energy consumption (42% of CO2 emissions from fossil fuels) and oil 36% (28% of emissions). The contribution of decarbonated energies remains low (nuclear 6% of primary consumption, hydroelectricity 6%, other renewable 1%) [18]. Nuclear energy is reluctant among the population, but has the advantage of a minimal influence on the natural environment, unlike most renewable energies. These remain dominated by conventional hydropower. Wind and solar energy, which are still marginal, are developing rapidly. But they require the development of storage techniques, or additional fossil fuels, to compensate for the intermittency of their activity. In addition, their impact is limited to electricity production, which accounts for hardly a third of the primary energy consumed.

Methods for deep CO2 capture have been proposed, either in geological formations or on the ocean floor, by adapting mining and petroleum techniques. However, their long-term reliability is difficult to demonstrate and their energy consumption is considerable. Their development would thus only aggravate the problem of energy resources, leading to the exploitation of “unconventional” deposits that are increasingly devastating for the environment.

It is probably by limiting deforestation and making the best use of agricultural resources that the most effective gains can be achieved in the medium term. Agriculture occupies 1/3 of the ice-free land area (12% for crops, 22% for pastures), and is estimated to absorb ¼ land primary production [19] (total organic matter production). Livestock is a source of 15% of greenhouse gas emissions, more than transport. Biofuels currently on the market (known as first generation) compete with food crops and cause deforestation. However, research on second- and third-generation biofuels raises hopes of using agricultural waste, improving current methanisation techniques (methane production by air-free fermentation).


References and notes

[1] However, it is necessary to mention the exception of Carbon 14 (constituting a proportion 10-12 of the carbon of living beings). This carbon isotope is produced in the upper atmosphere by the impact of cosmic radiation on nitrogen, then is transformed back into nitrogen by radioactivity with a period of 5730 years.

[2] Chen et al (2014) Hidden carbon in Earth’s inner core revealed by shear softening in dense Fe7C3. PNAS 111, 17755-17758, http://www.pnas.org/content/111/50/17755.full.pdf

[3] To do this, we notice that the total atmosphere contains 10.3 t/m2: it is the mass of the air column whose weight produces the average atmospheric pressure 1.013 x 10⁵ N/m2. The mole (NA molecules where NA is the Avogadro number) of CO2 containing 12 g of carbon and 32 g of oxygen, or 44 g, while an atmospheric mole contains 29 g (weighted average between nitrogen and oxygen), the mass proportion of CO2 is 44/29 = 1.52 times its proportion in molecules 400 x 10-6, or 607 x 10-6 of 10.3 t/m2, equal to 6.25 kg/m2 CO2. The mass proportion of carbon in CO2 being 12/44 = 27%, we find that 400 ppmv represents 1.69 kg/m2 of carbon or 860 GtC.

[4] IPCC Report 2013, chapter 6: Carbon and Other Biogeochemical Cycles, http://www.ipcc.ch/report/ar5/wg1http://www.climatechange2013.org/images/report/WG1AR5_ALL_FINAL.pdf

[5] Knorr W. (2009) Is the airborn fraction of anthropogenic CO2 emissions increasing? Geophys. Res. Letters 36, L21710, http://radioviceonline.com/wp-content/uploads/2009/11/knorr2009_co2_sequestration.pdf

[6] Levin I. & Hesshaimer V. (2000) Radiocarbon-a unique tracer of global carbon cycle dynamics, Radiocarbon 42, 69-80, http://archiv.ub.uni-heidelberg.de/volltextserver/6862/1/LevinRAD2000.pdf

[7] IPCC Report 2001: http://www.ipcc.ch/ipccreports/tar/wg1/108.htm

[8] Takahashi T. et al (2009) Climatological mean and decadal change in surface ocean pCO2, and net sea-air CO2 flux over the global oceans. Deep-Sea Res. II 56, 554-577. Results summarized on http://www.ldeo.columbia.edu/res/pi/CO2/carbondioxide/pages/air_sea_flux_2010.html.

[9] Feely R.A., Doney S.C. & Cooley S.R. (2009) Ocean acidification, special issue Oceanography 22 (4), http://tos.org/oceanography/issue/volume-22-issue-04.

[10] This increase factor, also dependent on temperature, is called the “Reveal Factor”, see Zeebe R. http://www.eoearth.org/view/article/154468

[11] Guinotte J.M. & Fabry V.J. (2008) Ocean acidification and its potential effects on marine ecosystems. Annals NY Acad. Sci. Volume 1134, The Year in Ecology and Conservation Biology, pp. 320-342.

[12] IPCC Report (2001), Working group 1, Chapter 3, The Carbon Cycle and Atmospheric Carbon Dioxide, https://www.ipcc.ch/ipccreports/tar/wg1/pdf/TAR-03.PDF; Biome: A set of ecosystems characteristic of a biogeographical area and named from the vegetation and animal species that predominate and are adapted to it.

[13] Houghton R.A. et al (2012) Carbon emissions from land use and land-cover change, Biogeosciences 9, 5125-5142, http://www.biogeosciences.net/9/5125/2012/bg-9-5125-2012.pdf

[14] Government of Alberta (2008) Alberta’s Oils Sands. Resourceful. Responsible. Government of Alberta, http://environment.gov.ab.ca/info/library/7925.pdf

[15] Laurance W.F. & Bierregaard R.O. (Eds.) (1997) Tropical Forest Remnants: Ecology, Management, and Conservation of Fragmented Communities. University of Chicago Press, Chicago, Illinois.

[16] Page S.E., Siegert F., Rieley J.O., Boehm H.-D.V., Jaya A. Limin S. (2002) The amount of carbon released from peat and forest fires in Indonesia during 1997, Nature 420, 61-65.

[17] Ziegler, A.D., Phelps, J., Yuen, J.Q., Webb, E.L., Lawrence, D., Fox, J.M., Bruun, T.B., Leisz, S.J., Ryan, C.M. & Dressler, W, (2012) Carbon outcomes of major land-cover transitions in SE Asia: great uncertainties and REDD+ policy implications. Global Change Biology 18, 3087-3099. http://onlinelibrary.wiley.com.gaelnomade.ujf-grenoble.fr/doi/10.1111/j.1365-2486.2012.02747.x/full

[18] IPCC Report (2007) 4th Report. Part 3, Mitigation, chapter 9, Forestry https://www.ipcc.ch/pdf/assessment-report/ar4/wg3/ar4-wg3-chapter9.pdf; table based on FAO data (2006), Global Forest Resources Assessment 2005. Progress towards sustainable forest management.FAO Forestry Paper 147, 320 pp.; MEA (2005) Millennium Ecosystem Assessment. Ecosystems and human well-being: Scenarios. Findings of the Scenarios Working Group. Island Press, Washington D.C.

[19] https://en.wikipedia.org/wiki/World_energy_consumption

[20] https://en.wikipedia.org/wiki/Primary_production


The Encyclopedia of the Environment by the Association des Encyclopédies de l'Environnement et de l'Énergie (www.a3e.fr), contractually linked to the University of Grenoble Alpes and Grenoble INP, and sponsored by the French Academy of Sciences.

To cite this article: JOYARD Jacques, SOMMERIA Joël (April 23, 2019), A carbon cycle disrupted by human activities, Encyclopedia of the Environment, Accessed November 21, 2024 [online ISSN 2555-0950] url : https://www.encyclopedie-environnement.org/en/life/carbon-cycle-disrupted-by-human-activities/.

The articles in the Encyclopedia of the Environment are made available under the terms of the Creative Commons BY-NC-SA license, which authorizes reproduction subject to: citing the source, not making commercial use of them, sharing identical initial conditions, reproducing at each reuse or distribution the mention of this Creative Commons BY-NC-SA license.

被人类活动干扰的碳循环

PDF
Encyclopédie environnement - carbone - couverture

  所有生物都是由碳原子构建的。由植物、藻类和某些特定的细菌利用太阳能从大气CO2中提取碳,此即光合作用。生物通过呼吸和分解作用将CO2重新释放到大气中。除了这种生物短循环外,还存在缓慢的地质循环,即以石灰石和化石碳氢化合物的形式储存碳。石灰岩中的碳来自海洋生物的外壳,而化石中的碳氢化合物由有机沉积物埋藏形成。目前,化石资源的燃烧代表从地质慢循环到生物短循环的加快,生物短循环在很大程度上主导着自然再生过程。这导致大气中的CO2迅速积累,造成全球变暖和海洋酸化,并可能破坏海洋生物。

1.起源

  与恒星核心的大多数轻元素相同,碳元素来自氢的核聚变(参阅核能),且含量相当丰富。地球和其他行星上的碳元素来自太阳系形成之前的恒星爆炸。在这种爆炸(超新星爆炸)过程中,可凝结物质形成了气体和尘埃云,随后在早期太阳星云内聚集形成行星。与所有非放射性元素相同[1],自地球形成以来,这种原始碳经历了不同环境,并与不同的分子结合,从而得以永久保存并循环起来。

  在地球形成之前坠落的碳质球粒陨石中,发现了基本完好无损地储存起来的原始碳。在彗星中也同样发现了原始碳。值得注意的是,碳参与了各种基本有机化合物的形成,例如碳氢化合物、醇和氨基酸(参阅如何研究彗星的有机分子)。像木星、土星这种巨型行星主要由氢(90 %)和氦(约10 %)组成,但碳(0.1 %)也以甲烷(CH4)或其他碳氢化合物的形式存在。

  像地球这种岩石星球,其形成过程中的高温导致金属元素(铁和镍)分离,这些金属元素是构成地幔中密度较低的硅酸盐的核心物质。据估计,地核[2]和地幔中的碳含量相当。地幔中,纯碳经过高温、高压结晶成为钻石:这些钻石存在于曾高度活跃的火山柱表面,因为表面迅速冷却可以阻止其状态发生改变。然而,地幔中的碳主要以碳酸盐的形式存在,占地幔质量的0.003 % 到0.03 %。在火山爆发期间,地幔中的碳以二氧化碳(CO2)的形式释放到大气中。在火星和金星,火山活动也释放二氧化碳,这也是这两个星球大气的主要成分。在光合作用(固定大气中的二氧化碳合成有机物,并释放氧气)出现之前,二氧化碳也是地球大气层的主要成分之一(参阅生物圈,地质过程的主要参与者)。

2.地球碳库

  碳以不同形式储存在“”中,表1列出了地球上的主要碳库。储量的单位为千兆吨(1 GtC = 1012 kg)。更直观地讲,这些储量可以用全球总表面积(5.1 亿平方千米)来表示。地表碳密度为1 kg/m2,则地表碳储量总计为510 GtC。目前大气以CO2的形式储存碳,含量为1.69 kg/m2,并在风的作用下均匀分布。这一数值可以从目前大气的CO2浓度中推断出来[3],目前CO2浓度为400 ppmv(1 ppmv表示体积占比或分子数占比为10-6),同时每增加1 ppmv的CO2,碳储量增加2.12 GtC。

  海洋碳含量几乎是大气碳库的50倍。溶解的CO2与水反应生成碳酸(H2CO3),与碳酸氢根HCO3(也称碳酸氢盐)和碳酸根CO32-达到化学平衡。以HCO3形式存在的碳占海洋碳的近95%。海洋—大气CO2交换沿大气到海洋或海洋到大气的单向输送,趋向于与温度相关的浓度比平衡状态。

  海洋生物活体的总质量被称为海洋生物量,其碳含量十分有限,仅有6 g/m2,主要储存在浮游生物和细菌中。陆地植被的碳含量约为1 kg/m2,而构成腐殖质的土壤有机碎屑中的碳含量为4 kg/m2。这也是相对于地球总表面积的平均值。

表1. 碳库(由于不确定性较高、且与环境相互作用有限,表中未提及地幔和地核)。

环境百科全书-生命-碳循环

  然而,在钙质岩中发现了更大的碳库,它由碳酸钙(CaCO3)和不同比例的结合而成。以这种方式固定的碳总质量约为140 t/m2。由于石灰岩中碳的质量占比为12 %,这就相当于平均厚度为500 m、质量为约1000 t/m2的石灰岩。石灰岩是很多地质构造的主要成分,如巴黎盆地(尤其以白垩形式)、科罗拉多大峡谷和一些巨型山脉。珠穆朗玛峰的顶峰也有石灰岩的踪迹(图1)。
环境百科全书-生命-碳循环
图1 珠穆朗玛峰山顶附近的石灰岩,由5亿年前的海洋生物壳形成。
[图片来源:Conrad Anker, http://www.montana.edu/everest/resources/pdf/GearActivity/RocksofEverest.pdf].

  另一部分的碳(约为20 t/m2)以未氧化的有机化石碳形式被储存。这种碳主要存在于沉积物和沉积岩(油母质)中,且浓度很低。其中一小部分会演变成甲烷(CH4),以水合物形式储存在洋底和冻土中。化石碳中只有一小部分(不足0.01 %)被浓缩、成熟和封存,产生可利用的碳氢化合物(天然气和石油)和煤炭(参阅原油:其生物来源的证据)。

  在亿万年的时间尺度上,沉积物通过构造运动被带走,其中部分整合到地幔中。据估计,地幔的总碳储量(虽未勘明)甚至高于石灰岩。

3.人类活动干扰的碳流动

  不同碳库之间的碳流动如图2(来自[4])所示,图中展示了工业化前后的状况及变化(红色数字)。红色数字首先是化石燃料储量的燃烧,2000-2010年间的数据作为参考值,这十年间的年排碳量为7.8 GtC。其他红色数字表示地球系统反应,这部分将在第4节中讨论。

  CO2通过溶解或脱气在大气与表层海水之间进行永久性交换。在赤道地区,由于富含CO2的深层海水上升后变暖,脱气作用占主导地位;而在极地地区,由于表层海水温度较低,溶解作用占主导地位。中纬度地区,季节性的温度变化决定着CO2交换的方向。当脱气作用与溶解作用基本达到平衡,每个方向的总流量平均约为80 GtC/年。
环境百科全书-生命-碳循环
图2 地球碳储量预计可以支持百年尺度上的碳交换(不包括石灰岩)和每年十亿吨的碳通量(或以pgC为单位,1 pgC=1GtC)黑色箭头表示与自然界碳交换的平衡通量,即工业时代开始前唯一存在的碳交换,黑色数字代表工业活动开始前的1750年的碳储量(估算值)。红色箭头表示2000-2009十年间人类活动影响下的平均碳通量(增加、减少或创造),红色数字表示1750-2011年碳储量的变化。

  最重要的碳流动与陆地植被的光合作用【指植物、藻类和某些细菌利用光吸收大气中的CO2合成有机物的生物能过程。利用太阳能氧化水和还原CO2,以合成有机物(碳水化合物)。水被氧化后形成氧气并释放到大气中。光合作用是自养的基础,是细胞和生物体内叶绿体综合作用的结果】有关,该过程每年可固定约100 GtC,理论上可以在十年内吸收大气中所有CO2。这个过程也被称为初级生产力,它为地球上所有的生命提供有机物。但光合作用固定的CO2几乎全部被呼吸【既指生物活体吸入和呼出空气引起的气体交换(释放二氧化碳、吸收氧气),也包含利用氧气降解葡萄糖并获取能量的细胞呼吸】作用释放的CO2所补偿,这就包括植物自身的呼吸、细菌分解有机物以及火灾,例如森林火灾(参阅泥炭地与沼泽——非凡的湿地)。
环境百科全书-生命-碳循环
图3 地球生物圈的分布。由OrbView-2航天器上的SeaWiFS仪器8年间拍摄的图片组合而成。图中的颜色分别代表(a)海洋表面:叶绿素的量(以mg/m3表示,即浮游生物量,参考左侧刻度);(b)陆地表面:植被指数(参考右侧刻度)。
[资料来源:NOAA]。

  海洋也是初级光合生产的重要场所,主要通过组成浮游植物的微生物(微藻类,包括硅藻;以及蓝细菌等)进行光合作用。卫星提供了浮游植物集中度、分布和更新率的准确数据及海洋初级生产量的可靠估算。通过观察图3海洋中的叶绿素可知,相比热带地区,南北纬40°至60°之间叶绿素含量更加丰富(大型河流入海口除外,如营养丰富的亚马逊河)。由叶绿素浓度观测值可以估算海洋初级生产量,该数值为每年50 GtC,约占陆地生产量的50 %。 值得注意的是,海洋生物碳储量相比陆地生物低近200倍(海洋中碳储量为3 GtC,而陆地上为500 GtC)。与陆地生物量中占主导地位的树木不同,海洋生物量中占主导地位的浮游植物由于生命周期短,几乎不储存碳。

  由于浮游植物对环境波动极为敏感,因此海洋初级生产的区域和季节差异明显。在某些富含磷酸盐和硝酸盐的水域(如某些河流的河口地区),由于海水表层的局部富营养化,浮游植物生物量激增(也称为水华)。光合作用的增加导致海水表层CO2含量下降,但大气CO2的溶解弥补了这一点。浮游植物和藻类被浮游动物、鱼类、软体动物等消费者捕食,这些消费者通过呼吸作用和分解作用再次生成大部分的CO2

  此外,死亡的生物体或粪便颗粒将有机碳带入海洋深处,为依赖表层海水光合作用的深海生物(称为异养生物)提供食物。然而,海底火山口附近是一个特例——生物通过类似光合作用的化学合成反应维持生命,能量来源不再是太阳能,而是硫化氢中的化学能(参阅极端环境微生物和黑烟生态系统)。

  海洋表层产生的有机碳中,只有一小部分(每年约0.2 GtC)聚集在海洋沉积物中,并在缺氧环境中缓慢分解,数百万年后形成碳氢化合物。煤炭起源于陆地,其产生始于3亿至3.5亿年前石炭纪第一批大树的出现(参阅生物圈,地质过程的主要参与者)。

  海洋生物的碳酸盐外壳在深海压力作用下沉淀、溶解、并释放出碳酸根离子。这种溶解使深海碳酸盐含量增加,例如有机颗粒的沉淀和再循环(生物泵)。相反,在浅海盆地,这些生物壳堆积并在缓慢的地质过程中形成石灰岩。石灰岩与有机沉积物是海洋—大气系统中唯一的海洋碳汇。相反,每年约有0.1 GtC的CO2通过海底火山喷发释放到大气中。

  石灰岩的溶解(质变)每年为海洋提供0.1 Gt的碳酸盐(石灰岩以及硅酸盐的溶解,也导致溶解于雨水中的大气CO2达到0.3 GtC /年)。这些碳通过河流,随后与土壤侵蚀形成的碳汇合。海洋每年从河流中获得0.9 GtC,但在工业化之前,这一输入基本可以与每年约0.7 GtC的海洋脱气抵消。

  大气、岩石和生物之间的碳交换在地球的古代历史中发挥了重要作用(参阅生物圈,地质过程的主要参与者),导致大气成分和气候发生了显著变化。然而,这些自然地质碳流仍然很低:它们通常比光合作用低1000倍,比化石燃料燃烧100。在过去的一个世纪中,人类活动控制了环境的变化。

4.上世纪CO2的积累

环境百科全书-生命-碳循环
图4 将工业时代以来每年因化石燃料燃烧和土地利用变化(森林砍伐)产生二氧化碳量与大气二氧化碳的年增长率(均以碳吨数表示)进行比较。比较结果表明,大气二氧化碳积累量是排放量的一半(46%)。1960年之前的浓度值通过冰芯中储存的气泡测得。 [资料来源W. Knorr, 2009,[5].]

  自工业时代以来,大气中的CO2含量迅速增加,而至少在过去一千年以来,这一数值一直保持在280 ppmv左右的水平。如图4所示,不仅大气CO2含量在增加,其增长速率也在加快。目前,增长速率约为每年4 GtC(或2 ppmv)。如果保持该速率增长,大气CO2含量将在80年内从当前的400 ppmv增加到560 ppmv,是工业化之前的两倍。如图4所示,该增长速率与人类活动的碳排放密切相关CO2排放主要来自化石燃料(煤炭、石油和天然气)的燃烧,此外还包括森林砍伐和水泥生产,后者生产时利用石灰石并释放出碳(占CO2排放量的3 %)。但是,大气中CO2的总增量仅有累计人为排放量的一半,这表明另一半的CO2正在被重新吸收,具体见下文。

  大气中CO2的积累通过增强与辐射和气候相关的温室效应引起全球变暖,同时还会导致海洋酸化,危害海洋生物。

       CO2中碳的同位素技术证实化石燃料燃烧对大气中CO2增加起主要作用(参阅放射性与核反应)。碳主要由同位素12C(包含6个质子和6个中子)和少部分的13C(7个中子)、14C(8个中子)组成。光合作用捕获13C的效率低于12C,因此相较于火山喷发释放的矿物碳,生物来源碳的13C/12C同位素比更低。我们观察到大气中CO2的同位素比13C/12C正在下降,这标志着其生物起源

       14C由宇宙辐射与高空大气中的氮进行核反应产生,随后混合到CO2中并在光合作用时被捕获,随后以固定的比例(10-12)被生物内吸收。14C具有放射性,其浓度逐渐降低,半衰期为5730年(这是进行生物遗体测年的方法)。更古老的化石燃料中14C已完全消失。

  然而,20世纪60年代发生的核爆炸曾导致14C浓度翻番,经过调整后,大气中14C的浓度有所降低。这表明增加的CO2来自化石燃料[6],而非目前的生物。

  此外,化石燃料燃烧消耗氧气。大气中O2浓度的降幅虽然较小,但仍可以测量。图5显示了O2的减少,以20世纪90年代观测到的CO2浓度增加(10年增加15 ppmv)为变量。观测到的CO2增量约为化石燃料燃烧预测值的一半(箭头1)。氧气的消耗量也较低,但比例不同。这可用于确认并评估吸收所排放CO2两种途径:一是溶解在海洋中(箭头2),但不会改变O2的浓度;二是光合作用,并以与减少CO2相同比例释放O2(箭头3)。另外,海洋变暖导致的溶解氧脱气作用十分有限(箭头4)。总之,由图5可知,20世纪90年代化石燃料产生的30 ppmv CO2中,8 ppmv溶解在海洋中,7 ppmv由光合作用固定,剩余的15 ppmv在大气中积累。
环境百科全书-生命-碳循环
图5 1990年代,大气中O2含量下降与CO2含量增加的关系(箭头0)。箭头(1)表示化石燃料燃烧的贡献,结合了已知比例的CO2增加和O2减少。箭头(2)表示海洋的溶解,它减少了大气中的CO2但不引起O2的变化;箭头(3)则代表了光合作用,它固定CO2并释放相等比例的O2。最后,海洋释放出一小部分溶解氧,因此CO2没有变化(箭头4)。[资料来源:《 IPCC报告2001》,[7].]

  图2中,2000年后的10年内(以GtC作为CO2的单位,1 ppmv等于2.12 GtC,详情参阅第2节),化石燃料燃烧产生的CO2增加到每年7.8 GtC,其中2.3 GtC溶解在海洋中,1.5 GtC由光合作用固定,剩余CO2以每年4 GtC的速率在大气中积累。

  除CO2外,隔绝空气的厌氧发酵以及石油或天然气田泄漏也以甲烷的形式将碳排放到大气中。尽管甲烷浓度比CO2低200倍,但对温室效应增强的贡献却是CO2的25%[8]。甲烷对温室效应的影响约是CO2的25倍,与工业化之前相比,它在大气中的浓度增加了2.5倍。冻土或海洋沉积物中的甲烷突然释放会加速全球变暖。但是,排放到大气中的甲烷只能存在约十年,因为甲烷会缓慢氧化为CO2。最终,人类活动以多种形式进行碳排放,特别是以每年30亿吨的速度生产的塑料,其中的十分之一到达海洋,并在被称为洋流的巨大涡旋核心积累(参阅海上塑料污染:“第七大洲”)。

5.海洋中的溶解

  海洋表层溶解的CO2浓度趋向于达到与其在大气中的分压比例相平衡。这是气体溶解度的一般特性,即亨利定律。这就是为什么打开一瓶香槟后,随着压力下降,溶解的CO2会逸出。温度升高,脱气增加,从而溶解度降低。因此,在温暖的热带海洋中,CO2逃逸到大气中;在极地地区,CO2溶解在海水中;总体呈平衡稳定状态。另一方面,全球变暖导致海洋脱气增加。然而,目前来看,海洋—大气之间以大气CO2增加导致的溶解为主。

  目前,海洋表层的矿物碳含量为24 ppm(每吨水24g)[9]。如果我们以海洋总质量1.4×10¹⁸ t计,这意味着其碳储量为33×1018 克,即33,000 GtC。实际碳储量估计为38,000 GtC,这是因为深海的碳浓度稍高于表层。根据亨利定律,平衡状态下,溶解的CO2浓度与大气压成正比,但是海洋中95 %的溶解碳以碳酸盐和碳酸氢根离子的形式存在。因此,溶解碳的相对增量仅有大气CO2相对增量的1/10[10]:大气CO2的年均增量为2 ppmv,占400 ppmv的0.5 %;因此海洋溶解碳的增量仅有其1/10,即24 ppm的0.05 %,0.012 ppm。该碳仅被海洋表层吸收:如果被整个海洋吸收,则碳通量为17 GtC/年,实际估计值为2.3 GtC/年(图2)。 吸收的CO2在深海处的扩散非常缓慢。

  相较于溶解碳浓度,海洋学家通常更喜欢测量海水的CO2平衡分压。该值是在不改变海水样品自身浓度的前提下,在足够小体积的空气中通过脱气得到。如果CO2平衡分压高于大气中CO2的分压,则溶解的CO2将逸出以恢复平衡;反之,大气中的CO2将会溶解。图6表明,CO2平衡分压接近大气CO2分压,并随其增加而增加,这证实了海洋表层与大气CO2之间的平衡。
环境百科全书-生命-碳循环
图6 大气中的CO2含量(以ppmv表示,相当于10-6个大气分压)和夏威夷群岛的海洋表层的CO2含量(以相同单位的平衡分压表示)。水的pH用绿色曲线、右侧刻度表示。大气中CO2的年波动是由光合作用和陆地生态系统呼吸的季节性变化引起的。海洋中CO2的波动更大,因为其混合程度远不如大气,但这种增加趋势已被多处海洋的平均值所证实。
[资料来源:海洋学,[9].]

  此外,溶解的CO2与水反应生成H+离子,引起海水酸度增加。酸度通过pH值来衡量,当溶液呈酸性时,pH值下降。图6清楚的反映了这种下降。海水酸化会限制珊瑚钙质骨架的合成,但具体方式因物种而异[11]

  但是,溶解平衡仅限于与大气直接接触的海洋,即受风搅动的数百米厚的海水层。由于海水分层(温度更高、密度较小的海水位于表层),深海不受大气影响。在极地地区,表层海水蒸发导致盐浓缩,冷却后其浓度可能超过深层海水,因此零星局部区域的表层海水可以渗透到深海处。据估计,注入深海的表层水流量为50×106 m3/s,而这当然可以通过上升到海洋表层的等量深海水进行全球流量补偿(海洋的总质量保持不变)。这部分流量约为每年1.5×1015 t,即深海水(1.4×10¹⁸ t)全部更新大约需要1000年。

  因此,每年有1.5×10¹⁵ t当前CO2平衡浓度的表层海水(2000年浓度为380 ppmv),被工业化前CO2平衡浓度的深层海水代替(浓度为280 ppmv,即低30%)。如我们所知,这表示溶解碳降低了10倍,即3 %或0.7 ppm。以此乘以总流量可知,相当于一口每年有1 GtC的碳被埋入深海。

  此外,我们可以看到,海洋表层溶解碳以每年0.012 ppm的速率增长,且在过去十年间充分混合均匀。选择整个海洋表面厚度300 米的混合层(注释:该层比图2中的“海洋表层”厚,后者仅限于光合作用的光能够穿透的区域)为基准,总面积为0.36×10¹⁵ m2,海水总质量为1.1×10¹⁷ t,计算可得,混合层的年均碳储量为1.3 GtC。加上排放到深海的碳(每年1 GtC),我们由大气观测数据推测可知,其碳储量为每年2.3 GtC。大气和海洋之间CO2通量图也证实了这一全球吸收通量值[8]

  只要全球变暖不影响洋流,该通量一定随大气CO2浓度增加而成比例地增加。但是,这种纯物理评估是非常概略的。它假定与沉积和溶解过程相关的生物泵稳定流动,流量为11 GtC/年,该过程在溶解碳的垂直混合过程中起关键作用。

6.植被的影响

  陆地植被在CO2通量,以及以可见的植被和土壤中腐殖质形式储存碳方面发挥关键作用。因此,尽管草原、稀树草原和半荒漠地区植被含量很低,但它们对地球碳库的贡献很大,详情见表2(参阅泥炭地与沼泽——非凡的湿地)。表2也表明,北方针叶林的土壤中储存着大量的碳,而热带森林尽管植被非常丰富,但土壤的碳储存能力较弱。

表2. 植被和土壤表层(1 m)的总碳储量(改编自IPCC,2001[12])。

环境百科全书-生命-碳循环

  据估计,每年由于森林砍伐造成的CO2排放量为1.1 GtC[13],占大气中温室气体增量的25 %。砍伐森林的原因包括:森林开发、为城市扩张提供空间、将森林转变为农田、开采矿石。例如,为露天开采阿萨巴斯卡油砂,加拿大艾伯塔省3,400 km2的北方针叶林遭到了破坏[14]生物燃料的大规模农业生产也具有破坏性,它促进了单一栽培的发展,如亚马逊地区的大豆以及印度尼西亚、马来西亚和泰国的棕榈油。

  从生态学和气候学的角度来看,热带森林的砍伐率是特别值得关注的问题。亚马逊地区每年砍伐森林10,000至30,000 km2[15],南美州每十年砍伐森林总面积的5%,非洲也所差无几(见表3)。在东南亚,因厄尔尼诺现象引起的大火正导致森林覆盖率下降。1997年,印度尼西亚的森林和泥炭地大火向大气释放了0.8到2.5 GtC的CO2[16]。亚洲森林面积维持稳定的背后是大量原始森林被破环并在原址栽培人工林,这也导致15年间植被碳储量减少了近四分之一(表3):由原始林的12-74 kg/m2降至人工油棕林的8.5-29 kg/m2 [17]

表3. 全球森林砍伐量(改编自IPCC,2007[18])。

环境百科全书-生命-碳循环

  另一方面,到世界其他地区的森林面积正在增长,抵消了部分森林砍伐。欧洲、北美和大洋洲的森林覆盖率增加。2000年代中期,总体净森林砍伐率约为每年70000 km2,略低于20世纪90年代的每年约90000 km2的砍伐速度 [16]。这意味着每十年森林表面积相对损失2 %,存储碳的损失更大,为3 %,相当于每年1.1 GtC(见表3)。

  然而,根据大气CO2与O2平衡可知(见图5),光合作用每年固定CO2总量为1.5 GtC。因此,2.6 GtC的森林碳汇足以抵消每年因森林砍伐产生的1.1 GtC碳源。这种“消失的碳”很可能储存在土壤中,但土壤碳储量的整体估测比植被更加困难。导致光合作用的增加因素包括以下几个:众所周知,在其他环境因素适宜的情况下,大气中的CO2浓度增加会促进光合作用;氮肥的广泛使用和全球变暖也可能促进植物生长,导致土壤有机物增加;海洋也可能成为碳汇,这意味着图2中依据古沉积物估测的0.2 GtC的年平均碳储量可能会增加。

7.人为碳排放的补救前景

  众所周知,化石燃料燃烧和森林砍伐导致大气中的CO2迅速增加,成为全球变暖和海洋酸化的根源。这些CO2中只有50 % 通过自然反馈被吸收。因此,至少需要减少50 % 的碳排放,才有希望维持CO2浓度稳定。

  碳排放的增加主要与人口的增加有关,后者在一个世纪内增加了四倍(2016年人口为74亿,而1916年约为18亿)。同期,人均碳排放总体上也增加了两倍,详情见图7。在人口大量增长的背景下将碳排放减少两倍,需要技术和消费习惯的重大变革。

      根据人均碳排放曲线可知,1970-2000年间,随着石油危机、核能发展和重工业衰落(尤其是苏联解体),人均碳排放出现了拐点。2000年后,由于大量使用煤炭(10年内消费量增加了50 %),人均碳排放进一步增加。目前,煤炭占一次能源消耗量的30%(占化石燃料CO2排放量的42 %),石油占消耗量的36 %(占CO2排放量的28 %)。低碳能源的占比仍然很低:一次能源中,核能占6 %,水电占6 %,其他可再生能源占1 %[18]。核能不受人们欢迎,但与大多数可再生能源不同,它对自然环境的影响最小。可再生能源仍以水电为主。风能和太阳能虽占比较小,但正迅速发展。然而,风能和太阳能的活动具有间歇性,因此需要发展存储技术或使用其他化石燃料作为储备。此外,它们受限于电力生产,而电力生产在一次能源消耗中占比不足三分之一。
环境百科全书-生命-碳循环
图7 人均CO2排放量的变化(以吨为单位)。蓝色曲线表示化石燃料燃烧和水泥生产排放的CO2(数据来源http://cdiac.ornl.gov/);而红色曲线增加了森林砍伐的排放量。
[资料来源:R.Houghton估测值,参考文献[12].]

  利用采矿和石油开采技术,已经提出了CO2捕获并在地下和海底深埋的方法。然而,它们的长期可靠性难以证明,并且能量消耗巨大。因此,该技术的发展只会加剧能源问题,导致“非常规”矿床的开采,对环境造成越来越大的破坏。

  限制森林砍伐并充分利用农业资源才可能在中期取得最有效的收益。农业占据无冰土地面积的1/3(农作物占12 %,牧场占22 %),估计占土地初级生产(有机物总产量)的1/4 [19]。畜牧业的碳排放占温室气体排放量的15 %,超过了运输业。当前市场上的第一代生物燃料与粮食作物竞争激烈,并导致了森林砍伐。然而,第二代和第三代生物燃料相关研究让人们看到了使用农业废物并改进当前的甲烷化技术(真空发酵产生甲烷)的希望。


参考文献和说明:

[1]但有必要指出, 14C 是个特例(占生物碳含量的10-12),这种碳同位素在高空大气中由宇宙辐射撞击氮所产生,衰变 5730年后又转变为氮。

[2] Chen et al (2014) Hidden carbon in Earth’s inner core revealed by shear softening in dense Fe7C3. PNAS 111, 17755-17758, http://www.pnas.org/content/111/50/17755.full.pdf

[3] 为此,我们注意到大气总含量为 10.3 t/ m2:这是空气柱的质量,其重量产生的平均大气压力为1.013 x 10⁵ N/m2。一摩尔CO2(NA 个分子,NA是阿伏加德罗数)含有 12 克碳和 32 克氧,即44 克,而一摩尔大气含有29克(氮和氧的加权平均值),CO2的质量比例为 44/29 = 1.52 倍,其分子比例为 400 x 10-6,即 10.3 t/m2的 607 x 10-6 ,等于 6.25 kg/m2的CO2。CO2中碳的质量比例为 12/44,即27%,我们得出 400 ppmv即kg/m2的碳或860 GtC。

[4] IPCC Report 2013, chapter 6: Carbon and Other Biogeochemical Cycles, http://www.ipcc.ch/report/ar5/wg1http://www.climatechange2013.org/images/report/WG1AR5_ALL_FINAL.pdf

[5]Knorr W. (2009) Is the airborn fraction of anthropogenic CO2 emissions increasing? Geophys. Res. Letters 36, L21710, http://radioviceonline.com/wp-content/uploads/2009/11/knorr2009_co2_sequestration.pdf

[6] Levin I. & Hesshaimer V. (2000) Radiocarbon-a unique tracer of global carbon cycle dynamics, Radiocarbon 42, 69-80, http://archiv.ub.uni-heidelberg.de/volltextserver/6862/1/LevinRAD2000.pdf

[7] IPCC Report 2001: http://www.ipcc.ch/ipccreports/tar/wg1/108.htm

[8] Takahashi T. et al (2009) Climatological mean and decadal change in surface ocean pCO2, and net sea-air CO2 flux over the global oceans. Deep-Sea Res. II 56, 554-577. Results summarized on http://www.ldeo.columbia.edu/res/pi/CO2/carbondioxide/pages/air_sea_flux_2010.html.

[9] Feely R.A., Doney S.C. & Cooley S.R. (2009) Ocean acidification, special issue Oceanography 22 (4), http://tos.org/oceanography/issue/volume-22-issue-04.

[10] This increase factor, also dependent on temperature, is called the “Reveal Factor”, see Zeebe R. http://www.eoearth.org/view/article/154468

[11] Guinotte J.M. & Fabry V.J. (2008) Ocean acidification and its potential effects on marine ecosystems. Annals NY Acad. Sci. Volume 1134, The Year in Ecology and Conservation Biology, pp. 320-342.

[12]IPCC Report (2001), Working group 1, Chapter 3, The Carbon Cycle and Atmospheric Carbon Dioxide, https://www.ipcc.ch/ipccreports/tar/wg1/pdf/TAR-03.PDF; Biome: A set of ecosystems characteristic of a biogeographical area and named from the vegetation and animal species that predominate and are adapted to it.

[13]Houghton R.A. et al (2012) Carbon emissions from land use and land-cover change, Biogeosciences 9, 5125-5142, http://www.biogeosciences.net/9/5125/2012/bg-9-5125-2012.pdf

[14] Government of Alberta (2008) Alberta’s Oils Sands. Resourceful. Responsible. Government of Alberta, http://environment.gov.ab.ca/info/library/7925.pdf

[15]Laurance W.F. & Bierregaard R.O. (Eds.) (1997) Tropical Forest Remnants: Ecology, Management, and Conservation of Fragmented Communities. University of Chicago Press, Chicago, Illinois.

[16] Page S.E., Siegert F., Rieley J.O., Boehm H.-D.V., Jaya A. Limin S. (2002) The amount of carbon released from peat and forest fires in Indonesia during 1997, Nature 420, 61-65.

[17] Ziegler, A.D., Phelps, J., Yuen, J.Q., Webb, E.L., Lawrence, D., Fox, J.M., Bruun, T.B., Leisz, S.J., Ryan, C.M. & Dressler, W, (2012) Carbon outcomes of major land-cover transitions in SE Asia: great uncertainties and REDD+ policy implications. Global Change Biology 18, 3087-3099. http://onlinelibrary.wiley.com.gaelnomade.ujf-grenoble.fr/doi/10.1111/j.1365-2486.2012.02747.x/full

[18] IPCC Report (2007) 4th Report. Part 3, Mitigation, chapter 9, Forestry https://www.ipcc.ch/pdf/assessment-report/ar4/wg3/ar4-wg3-chapter9.pdf; table based on FAO data (2006), Global Forest Resources Assessment 2005. Progress towards sustainable forest management.FAO Forestry Paper 147, 320 pp.; MEA (2005) Millennium Ecosystem Assessment. Ecosystems and human well-being: Scenarios. Findings of the Scenarios Working Group. Island Press, Washington D.C.

[19] https://en.wikipedia.org/wiki/World_energy_consumption

[20] https://en.wikipedia.org/wiki/Primary_production


The Encyclopedia of the Environment by the Association des Encyclopédies de l'Environnement et de l'Énergie (www.a3e.fr), contractually linked to the University of Grenoble Alpes and Grenoble INP, and sponsored by the French Academy of Sciences.

To cite this article: JOYARD Jacques, SOMMERIA Joël (March 13, 2024), 被人类活动干扰的碳循环, Encyclopedia of the Environment, Accessed November 21, 2024 [online ISSN 2555-0950] url : https://www.encyclopedie-environnement.org/zh/vivant-zh/carbon-cycle-disrupted-by-human-activities/.

The articles in the Encyclopedia of the Environment are made available under the terms of the Creative Commons BY-NC-SA license, which authorizes reproduction subject to: citing the source, not making commercial use of them, sharing identical initial conditions, reproducing at each reuse or distribution the mention of this Creative Commons BY-NC-SA license.