Distribution of biomass on the planet
PDF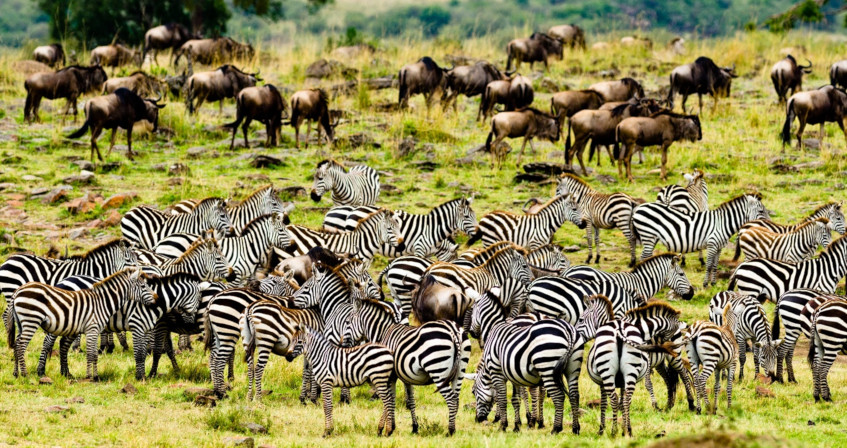
What does the biosphere represent on Earth? How is the biomass distributed between oceans and continents? While hiking in the mountains, in the forest or while scuba diving, we appreciate the diversity of nature: the colorful flora of an alpine meadow, the incredible diversity of the fauna of a lagoon and the discreet tracks of animals in a forest! The contrast between biomesecosystems characteristic of a biogeographic area. A biome is the expression of the ecological conditions of the place (climate, soils, etc.); it is defined by a vegetation presenting a dominant form of life (trees, shrubs, herbaceous plants) which remains stable over generations. Tropical or temperate deciduous forests (i.e. populated by very large deciduous trees), mangroves, tundra are examples of biomes. marine and terrestrial is striking, but quantifying these differences remains difficult. Our vision of the species that inhabit the planet is biased. We notice the most visible organisms – or the largest – but we are far from imagining the importance of “the invisible majority” [1], the prokaryotesMicroorganisms (generally unicellular) with a simple cell structure, with no nucleus, and almost never any internal compartmentalization (an exception being the thylakoids in cyanobacteria). Two of the three groups constituting life are prokaryotes, the Archaea and the Bacteria or more broadly the microorganisms, especially in soils. How to correctly estimate the global biomass of all living organisms and quantify the abundance of the biosphere’s constituents? This is a fundamental question in biology. The quantification of the biomass of living organisms on Earth presented here – broken down by major taxonomic groupsRelates to taxonomy or taxonomy, the branch of biological sciences that involves describing living organisms and organizing them into hierarchical categories called taxa. Generally the term “taxon” is used at the specific (the species) and subspecific (the subspecies) levels., ecological strategies and global environments – provides a basis for exploring today’s major environmental issues.
1. Biodiversity, living matter and biomass
1.1. From biodiversity to the quantitative account of the biomass
Centuries of observation of nature have led to an increasingly detailed – but still incomplete – picture of the species that inhabit our planet and their respective roles in the various ecosystems (see What is biodiversity?). Since the beginning of the century, several major technological and scientific advances have expanded our understanding of biodiversity on Earth:
- New approaches to genome sequencing have enabled a more detailed view of the composition of many natural communities. By characterizing short fragments of their DNA that persist in the environment, it is thus possible to inventory the biodiversity of an ecosystem from samples of water, soil, etc. (See DNA barcoding to characterize biodiversity) ;
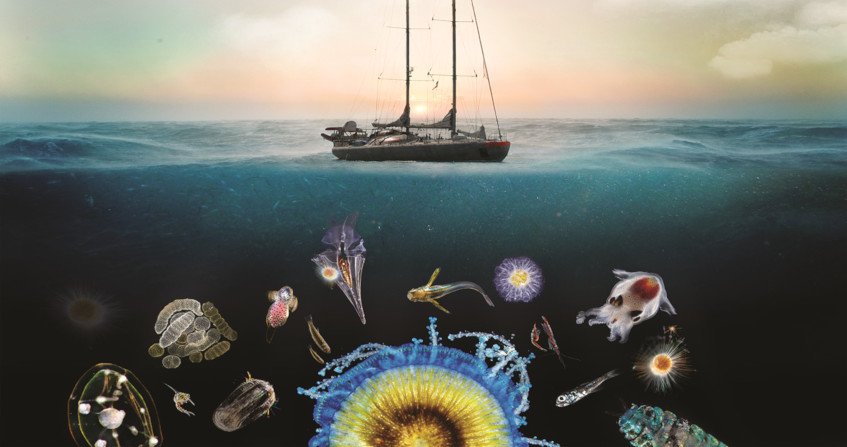
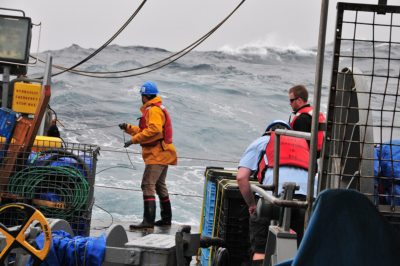
- Recent global sampling efforts, such as those of the Tara Oceans expedition (Figure 1) and its continental counterparts around the world, are providing more robust descriptions of the populations of natural habitats (See When the Tara Oceans expedition explores plankton diversity) ;
- Better remote sensing tools enable to probe the environment on a global scale with unprecedented resolution and specificity. [See for example the NASA Earth Observatory video on ocean phytoplankton: Feeding the Sea: Phytoplankton Fuel Ocean Life]
Such a comprehensive quantitative analysis of the biomass of each taxonUnit of the hierarchical classifications of living things. Generally the term is used at the specific (species) and subspecific (subspecies) ranks. was recently proposed by an Israeli team [4,5]: through a meta-analysis of published data, Bar-on et al. have assembled a census of the biomass of all kingdoms of life and have provided a holistic view of the composition of the biosphere on land and in the oceans, a theory or approach that focuses on an object as a whole, as a constituent of a whole. This has allowed the construction of specific models of taxonomic categories, geographical locations and trophic modes. The general framework of this strategy is summarized in the associated focus (See How to estimate global biomass?).
1.2. Carbon as a marker of organic matter and life
Microbial, plant or animal biomass is mostly composed of water, minerals and organic compounds; it therefore contains a large amount of hydrogen, oxygen, carbon and, to a lesser extent, nitrogen (Table 1). Life concentrates some of the elements that are not abundant on the Earth as a whole. For example, the atmosphere is rich in nitrogen and oxygen but contains little carbon and hydrogen, while the Earth’s crust, although containing oxygen and a small amount of hydrogen, contains little carbon and nitrogen. Thus, carbon is a sort of marker of organic matter (living or dead organisms).
Table 1. Approximate percentage of elements in living organisms (e.g., humans) compared to the earth’s crust or atmosphere [6].
Biosequestrated carbon is directly related to the biomass formed by photosynthetic organisms (cyanobacteria, green plants…). They absorb the sun’s energy, capture water (H2O) and carbon dioxide (CO2) and convert them into sugars and oxygen (O2) in a process called photosynthesis (See Shedding light on photosynthesis and The path of carbon in photosynthesis). The equation for photosynthesis can be summarized as follows:
- 6 CO2 + 12 H2O + light → C6H12O6 (glucose) + 6 H2O + 6 O2
The colossal amounts of living matter made continuously by photosynthesis are then used every day in a vast dynamic balance of life, death, nutrition, metabolism, growth, and decay [7]. Thus, the carbon fixed in plant biomass (i.e. biosequestered carbon) enters the food chain as it is used by a wide variety of organisms linked together by trophic relationships. Plants (producer organisms) are consumed by herbivorous animals (consumer organisms) with the help of associated microorganisms (microbiota). In the oceans, biomass enters the food chain through phytoplankton. Most living organisms use aerobic respiration{end-text}Characterizes a system (e.g., a living organism) or process (e.g., respiration) that requires O2 oxygen. The term aerobic is also used in aeronautics, in the field of propulsion: an aerobic engine uses the oxygen of the ambient air as oxidizer for its operation. {end-tooltip}Aerobic respiration is a process which transfers chemical energy from glucose into ATP, the key molecule of cellular energy metabolism. Aerobic respiration is the catabolism of nutrients (glucose) into carbon dioxide, water and ATP, and involves an electron transport system in which oxygen is the final electron acceptor. The overall reaction of respiration is as follows:
- C6H12O6 (glucose) + 6 O2 + 36 (ADP+Pi) → 6 CO2 + 6 H2O + 36 ATP
1.3. Measuring biomass: dry weight and carbon content
In their meta-analysis of the biomass of living organisms in the biosphere on the whole planet, Bar-on et al [4,5] expressed the biomass in gigatons of carbon, with 1 Gt C = 1015 g of carbon.
This reference to the quantity of carbon is thus a way of estimating (i ) what the different taxa represent in terms of biomass and (ii ) their relative importance within the biosphere. Of course, the carbon contained in living organisms does not represent the totality of the carbon in soil organic matter. This organic matter, which comes mainly from the decomposition of plants in the soil, constitutes considerable stocks of carbon (see La place des sols dans le cycle du carbone). Similarly, the organic matter accumulated in the oceans represents quantities of carbon far greater than that which can be measured in living organisms (See The biological carbon pump of the ocean).
2. Distribution of biomass in the biosphere
2.1. Plants dominate in terms of biomass
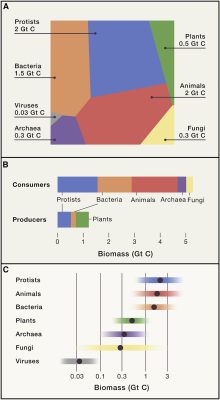
The best estimates of the biomass of each taxonUnit in hierarchical classifications of living things. Generally the term is used at the specific (species) and subspecific (subspecies) ranks. [8] analyzed are shown in Figure 3 [9]. The sum of the biomass across all taxa on Earth is estimated to be about 550 Gt C, of which:
- ≈80% (≈450 Gt C) are plants [10];
- ≈15% (≈70 Gt C) are bacteria, the second major component of biomass ;
- the remainder is due to other groups; in descending order: fungi (≈12 Gt C), archaeaNucleus-free single-celled microorganisms often (but not always) living in extreme environments (anaerobic, high salinity, very hot…). The phylogenetic research of Carl Woese and George E. Fox (1977) allowed to differentiate the archaea from other organisms. Currently, it is considered that life is made up of three groups: archaea, bacteria and eukaryotes. (≈8 Gt C), protistsEukaryotic microorganisms with a so-called simple cellular organization, unicellular most often, multicellular sometimes but without specialized tissues. They are eukaryotes other than an animal, a fungus or a plant. This group is very heterogeneous, both anatomically and physiologically. Some protists are autotrophic organisms (called protophytes), others are heterotrophic (called protozoa) and still others are mixotrophic as some dinoflagellates. The term “protophyte” was coined by Ernst Haeckel in 1866, from the Greek protestos, superlative of protos, “first,” the biologist placing in this taxon the organisms he considered the first living things on Earth. (≈4 Gt C), animals (≈2 Gt C) and viruses (≈0.2 Gt C).
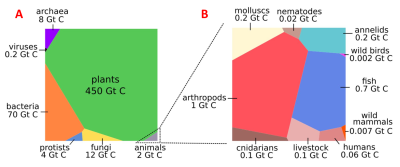
Thus, despite the large uncertainty associated with the total biomass of bacteria [10], plants are the dominant group in terms of biomass with a probability of ≈90%.
Plant biomass is dominated by terrestrial plants, specifically vascular plants, with only a minor contribution from bryophytesA branch of the plant kingdom, bryophytes (mosses, liverworts, sphagnum mosses…) do not possess a true vascular system (lack of roots and vessels). They have thallus (plant tissues composed of undifferentiated cells where we recognize neither leaves, nor stems) or small leaves. Among the current plants, the terrestrial and aquatic bryophytes are those which preserved the most characters of the first plants having colonized the dry land. The ancestors of all terrestrial plants, and therefore of bryophytes, are the green algae Charophyceae. (e.g. mosses) and of all marine plant biomass. This plant biomass represents that of forest and non-forest ecosystems and takes into account the impacts of land-use change.[12] Plant tissues are composed of an extracellular scaffold made out of cell walls (mainly cellulose and lignin), enclosing a cytoplasmic network, termed the protoplasm. The ratio of protoplasm to cell wall varies between plant compartments, with leaves containing the least amount of supporting tissue, while the stems of woody plants (such as trees) are primarily composed of supporting tissue:
- ≈70% of the plant biomass are due to the stems and trunks of trees, and are therefore relatively metabolically inert;
- The remaining ≈30% is concentrated in highly metabolically active plant tissues (mainly leaves and metabolically active root parts).
Bacteria include about 90% of the biomass in deep subsurface (primarily in aquifers and beneath the seafloor), which have very slow metabolic activity and associated biomass carbon turnover times of months to thousands of years. Excluding these contributions, global biomass is still dominated by plants, consisting mainly of ≈150 Gt C of plant roots and leaves and ≈9 Gt C of terrestrial and marine bacteria whose contribution is nearly equal to the ≈12 Gt C of fungi.
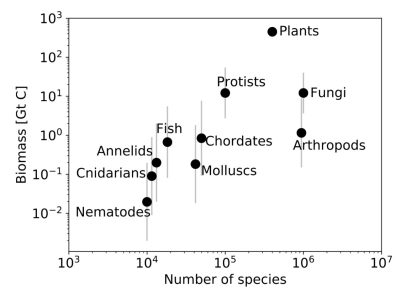
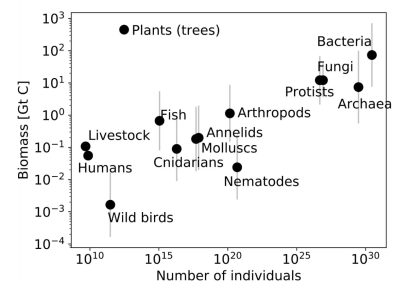
At present, about 1.7 to 2 million species have been described, but the number is estimated to be between 3 and 100 million species. Figure 3 represents the relationship between species richness and biomass of different taxa. Bacteria, archaea, and viruses are not included in this representation because species definition is problematic for these organisms.
Fungi, arthropodsBranch of invertebrate animals (insects, spiders, millipedes, crustaceans …) whose organizational plan is characterized by a segmented body with articulated appendages and covered with a cuticle or a rigid carapace, which constitutes their exoskeleton, in most cases consisting of chitin. Appearing 543 million years ago, the phylum of arthropods is by far the one with the most species and the most individuals in the entire animal kingdom (80% of known species) [13] and plants present the largest number of species. Flowering plants account for most of the terrestrial biomass, distributed among about 380,000 species [14]. 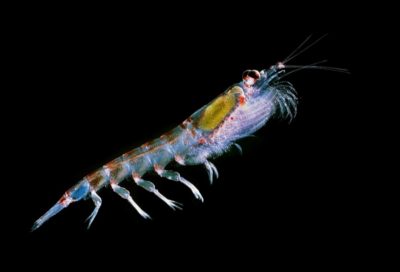
3. Distribution of biomass across biotopes and trophic modes
3.1. Biomass of organisms living in different environments
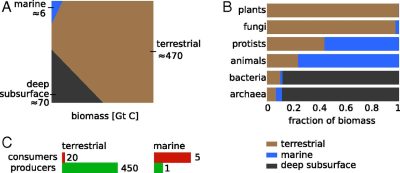
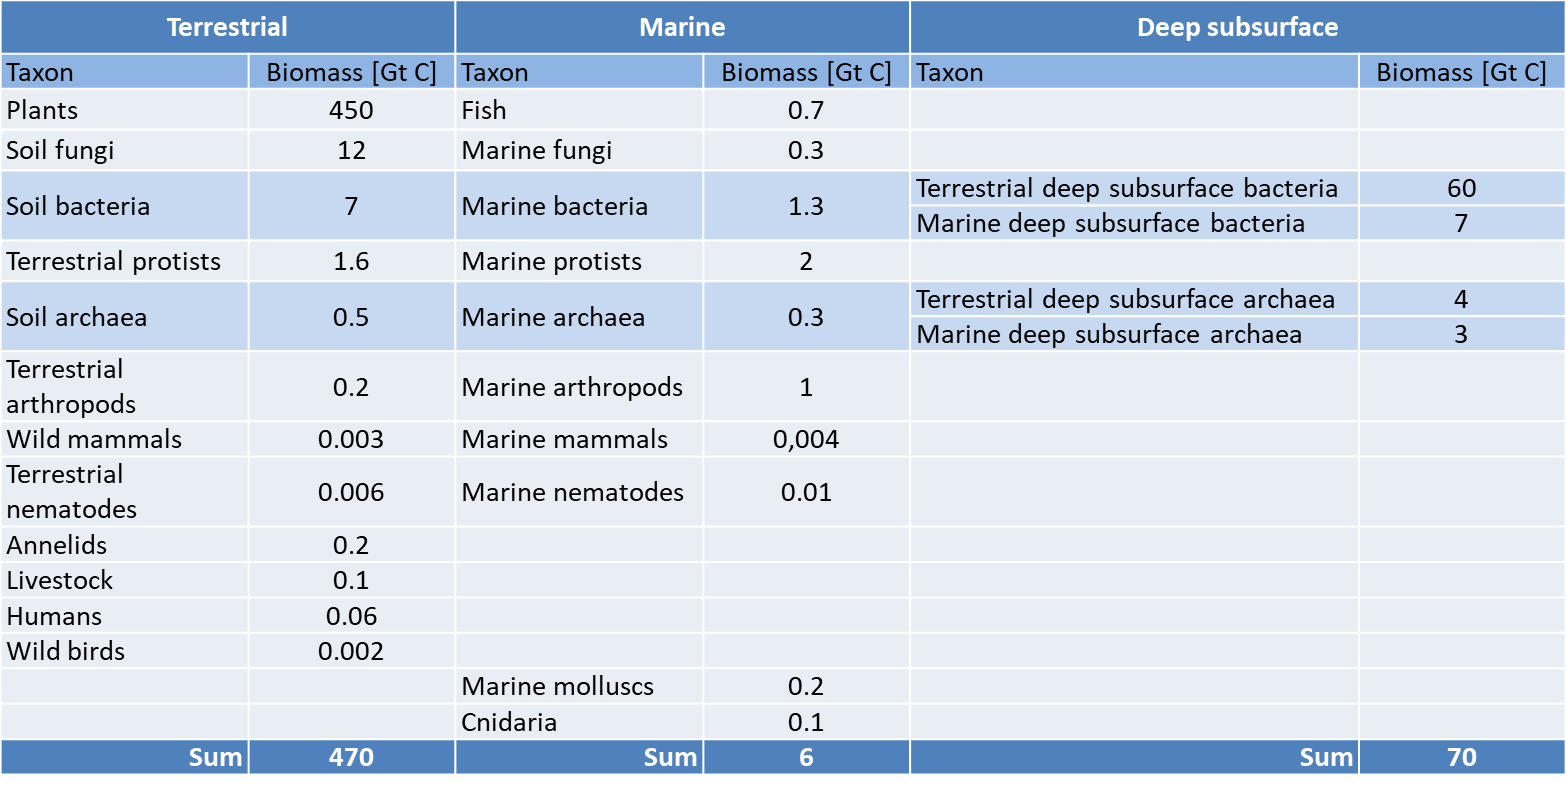
- For plants, most biomass is concentrated in terrestrial environments (plants are only a small fraction of marine biomass, <1 Gt C, in the form of algae -green and red- and seagrass; Figure 7B).
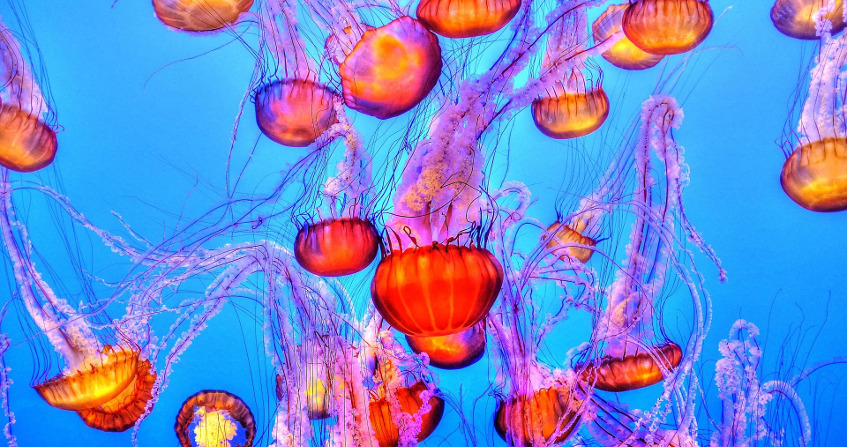
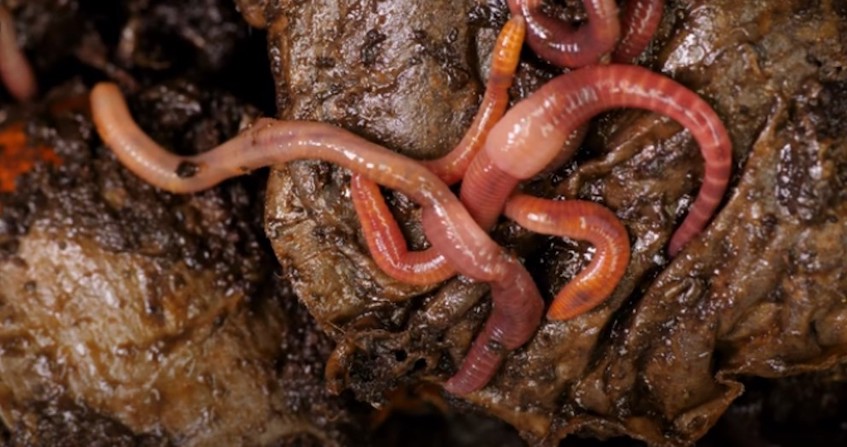
- For animals, most biomass is concentrated in the marine environment, from fish (≈0.7 Gt C), marine arthropods (≈1 Gt C), molluscs, and annelids.
- For bacteria and archaea, most of the biomass is concentrated in deep subsurface environments [24],[25], such as deep aquifers and the ocean’s crust, which may hold the largest aquifer on Earth [26].
Table 2. Global biomass of taxa in terrestrial, marine, or deep subsurface environments. [Table based on data from Bar-On et al. ref [4]; Open access article distributed under CC BY-NC-ND 4.0 license]
However, several of the results in Figure 7B should be interpreted with caution due to the large uncertainty associated with some of the estimates, primarily those for total terrestrial protists, marine fungi, and -more broadly- contributions from deep subsurface environments (See Focus How to estimate global biomass?).
3.2. Biomass of organisms living in the oceans
In the oceans (Figure 8), the biomass of living organisms decreases in the following order
- Animals, mainly represented by Crustacea (a sub-branch of the Arthropoda; mainly copepods, shrimps and krill, see Figure 5) and fishes (mainly small fishes of the mesopelagic zone);
- Protists, both unicellular with, in particular, the Diatoms, Coccolithophorids and Dinoflagellates… and multicellular organisms with, essentially, the Phaeophyceae [27] (such as kelp and other brown algae);
- Bacteria, and in particular the cyanobacteria of the genera Prochlorococcus and Synechococcus whose biomass is estimated at ≈15% of the marine bacterial biomass;
- Plants (in the broad sense – the Archaeoplastids – including green and red algae [24] as well as flowering plants such as eelgrass or posidonia beds);
- Archaea, whose biomass corresponds to ≈20% of the marine bacterial biomass;
- Viruses, in particular phages, which play an important role in the recycling of nutrients during the lysis of marine bacteria (See focus Ocean viruses & The biological carbon pump of the oceans). While marine viruses outnumber bacteria and archaea by about an order of magnitude in various habitats [28], in terms of biomass in the ocean, they constitute only a tiny fraction, ≈1%, of the total biomass.
- Fungi, found both in the deep ocean and in coastal waters such as mangroves or low salinity estuaries.
In terms of habitat, the majority of marine biomass is planktonic (transported by ocean currents), a much smaller fraction belongs to {tooltip}necton{end-text}A set of marine organisms whose swimming ability is such that they can move against currents (fish, some crustaceans, cephalopods, and marine mammals).{Then there are the organisms attached to particles (attached to micro- or macro-aggregates in the open sea) and finally the organisms living on the sea floor (or benthic). This global representation varies according to the kingdom. Thus, macroalgae can be both benthic and planktonic (for example, the common genus of brown algae Sargassum). In contrast, most plant biomass is benthic and not planktonic. However, this distribution must take into account the large uncertainties associated with the analyses (see Focus on How to estimate the global biomass?) and the fact that the global biomass of the many hot spots on the ocean floor (submarine canyons for example) is still largely unknown.
By providing a better understanding of the structure of ocean ecosystems and their biomass, this study allows us to better parameterize the carbon stock of these environments. This is an important element for climate models.
3.3. Biomass of producers and consumers
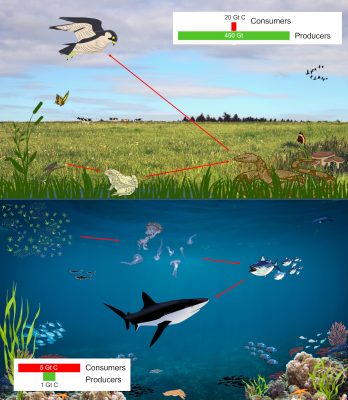
In the terrestrial environment, plant biomass represents the total biomass of terrestrial autotrophs. The remaining terrestrial biomass, including soil bacteria (≈7 Gt C), soil archaea (≈0.5 Gt C), soil fungi (≈12 Gt C), soil protists (≈1.5 Gt C), and terrestrial animals (≈0.5 Gt C), are considered terrestrial heterotrophs (See Focus Soil biomass).
In the marine environment, the total biomass of seagrasses (≈0.1 Gt C), macroalgae (≈0.1 Gt C), picoplankton (≈0.4 Gt C), diatoms (≈0.3 Gt C), and Phaeocystis (≈0.3 Gt C) yields an estimate of total marine autotroph biomass of ≈1.3 Gt C. The remaining marine biomass of ≈5 Gt C including marine bacteria (≈1.3 Gt C), archaea (≈0.3 Gt C), fungi (≈0.3 Gt C), heterotrophic protists (≈1.1 Gt C), and animals (≈2 Gt C), was considered as marine heterotrophic biomass.
This study confirms a well-known observation in ecology: in oceans, the biomass of consumers far exceeds that of producers (≈5 Gt C versus ≈1 Gt C). Conversely, on land, the biomass of primary producers is much larger than that of primary and secondary consumers (Figure 9).
Such inverted biomass distribution in the oceans can be explained by a higher turnover rate of producers than consumers: marine primary producers renew their biomass rapidly (on the order of a few days [29], whereas consumers renew their biomass only much more slowly, a few years in the case of mesopelagic fish [30]). Thus, the standing stock of consumers is larger, even though the productivity of producers is necessarily higher. Inverted consumer/producer ratio has also been described for the global plankton biomass [31]. This holds true when considering the overall biomass of all producers and consumers in the marine environment.
It should be noted that the biomass of parasites is not yet separated from that of their hosts. It might be larger than the biomass of top predators in some environments [32].
4. The impact of humanity on the biosphere
4.1. Humans represent only a small fraction of animal biomass
Over the relatively short period of human history, major innovations, such as the domestication of livestock, the adoption of an agricultural lifestyle, and the industrial revolution, have allowed for dramatic increases in human population and have had radical ecological effects on global biomass [6] (See Impacts of agriculture on biodiversity and ecosystem functioning).
- Today, human biomass (≈0.06 Gt C) and livestock biomass (≈0.1 Gt C, dominated by cattle and pigs) far exceed that of wild mammals, whose mass is ≈0.007 Gt C.
- The same is true for wild and domesticated birds, for which the biomass of domesticated poultry (≈0.005 Gt C, dominated by chickens) is about three times higher than that of wild birds (≈0.002 Gt C).
- In fact, the biomass of humans and livestock exceeds that of all vertebrates combined, except fish.
- Although humans and livestock dominate the mammalian biomass, they represent only a small fraction of the ≈2 Gt C of animal biomass, which primarily includes arthropods (≈1 Gt C), followed by fish (≈0.7 Gt C).
4.2. Humans reshaped the planet’s biomass
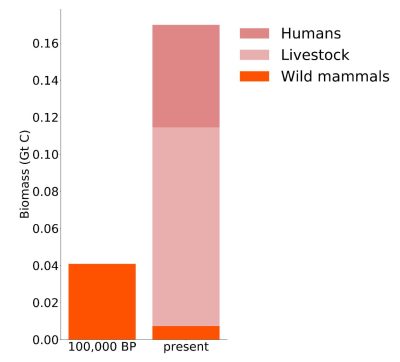
- Human activity contributed to the Quaternary megafauna extinction between ≈50,000 and ≈3,000 years ago, which took away about half of the large (>40 kg) terrestrial mammal species [33]. The biomass of wild terrestrial mammals prior to this extinction period was estimated by Barnosky [29] to be ≈0.02 Gt C. The current biomass of wild terrestrial mammals would be about seven times lower, at ≈0.003 Gt C.
- Intense whaling and exploitation of other marine mammals have resulted in an approximately fivefold decrease in overall marine mammal biomass (from ≈0.02 Gt C to ≈0.004 Gt C [34]).
- While the total biomass of wild mammals (marine and terrestrial) has decreased by about a factor of 6, the total mammal mass increased approximately fourfold, from ≈0.04 Gt C to ≈0.17 Gt C due to the vast increase in the biomass of humanity and its associated livestock.
Human activity has also impacted global vertebrate stocks, with a decrease of ≈0.1 Gt C in total fish biomass, an amount similar to the total biomass remaining in fisheries and tto the gain in the total mammal biomass due to livestock husbandry.

5. Take-home messages
- The census of biomass distribution (≈550 Gt C) on Earth provides an integrated global picture of the relative and absolute abundances of all kingdoms of life: plants (≈450 Gt C), bacteria (≈70 Gt C), archaea (≈7 Gt C), and animals (≈2 Gt C) ;
- Terrestrial biomass is about two orders of magnitude higher than marine biomass, and a total of ≈6 Gt C is estimated in marine organisms;
- Plant biomass (which dominates the biosphere) is mostly located on land; it accounts for less than 10% of the total biomass in the ocean.
- Animals, protists, and bacteria together account for ≈80% of marine biomass, whereas on land they account for only ≈2%.
- The animal biomass is predominantly marine; it consists of small mesopelagic fish and crustaceans, mainly copepods, shrimp, and krill.
- The marine environment is primarily occupied by microbes, primarily bacteria and protists, which account for ≈70% of the total marine biomass. The remaining ≈30% is primarily composed of arthropods and fish.
- Viruses dominate the ocean in terms of numbers but constitute only ≈1% of the total biomass.
- The deep subsurface holds ≈15% of the total biomass of the biosphere. It is mainly composed of bacteria and archaea.
- The global marine biomass pyramid contain much more consumers (≈5 Gt C) than producers (≈1 Gt C). Conversely, on land, the biomass of primary producers (≈450 Gt C) is much larger than that of primary and secondary consumers (≈20 Gt C).
- The mass of humans is an order of magnitude greater than that of all wild mammals combined.
- Humans have had a historical impact on the overall biomass of most important taxa, namely:
- The huge decrease in total biomass of wild animals, including fish;
- The gain in total mammalian biomass due to livestock husbandry;
- The profound reshaping in the total quantity of carbon sequestered by plants.
- The main gaps in our knowledge concern the distribution of biomass among different microbial taxa, such as bacteria, archaea, protists and fungi.
- Our knowledge of the biomass composition of the different taxa is mainly determined by our ability to sample, for example, in deep marine subsurface environments.
—
This text is based on work by the team of Ron Milo (Weizman Institute of Science, Rehovot, Israel), published in open access and distributed under a Creative Commons license (CC BY-NC-ND 4.0):
- Bar-On Y.M., Phillips R. & Milo R. (2018) The biomass distribution on Earth. Proc. Nat. Acad. Sci. U.S.A. 115:6506-6511 ; DOI: 10.1073/pnas.1711842115
- Bar-On, Y.M. & Milo R. (2019) The biomass composition of the oceans: A blueprint of our blue planet, Cell, 179 :1451-1454; https://doi.org/10.1016/j.cell.2019.11.018
—
The author is very grateful to Mr. Pascal Combemorel (Planet-Vie) and Prof. Laurence Després for their critical review of this text.
Notes and references
Cover image. A certain idea of biomass: Zebra (Equus zebra) and wildebeest (Connochaetes taurinus) in the African savannah, Masai Mara National Reserve, Kenya. [Source: photo © Jacques Joyard]
[1] Whitman W.B., Coleman D.C. & Wiebe W.J. (1998) Prokaryotes: The unseen majority. Proc. Natl. Acad. Sci. USA 95:6578-6583.
[2] Carvalhais N. et al. (2014) Global covariation of carbon turnover times with climate in terrestrial ecosystems. Nature 514:213-217.
[3] Quere C.L. et al. (2005) Ecosystem dynamics based on plankton functional types for global ocean biogeochemistry models. Glob. Change Biol. 11:2016-2040.
[4] Bar-On Y.M., Phillips R. & Milo R. (2018) The biomass distribution on Earth. Proc. Nat. Acad. Sci. U.S.A. 115:6506-6511; DOI: 10.1073/pnas.1711842115
[5] Bar-On, Y.M. & Milo R. (2019) The biomass composition of the oceans: A blueprint of our blue planet, Cell, 179 :1451-1454; https://doi.org/10.1016/j.cell.2019.11.018
[6] https://courses.lumenlearning.com/wmopen-nmbiology1/chapter/atoms-and-elements/
[7] Vernadsky V.I. (1998) Photosynthetic living matter. The Biosphere (Copernicus, New York, NY), pp 72-84.
[8] Our knowledge of the biomass composition of different taxa is mainly determined by the ability to sample their biomass in nature, for example in deep ocean and crustal environments. The main gaps in our knowledge concern the distribution of biomass among different microbial taxa, such as bacteria, archaea, protists and fungi.
[9] The data set collected and analyzed by Bar-on et al [4,5] is available on GitHub. The data representation for the figures is done using the Proteomaps tool.
[10] What Bar-On et al. (ref. [4]) define as plants are the set of Embryophytes (which are called land plants), green algae and red algae. For French-speaking authors (Romaric Forêt and his Dictionnaire de sciences de la vie, Le Guyader & Lecointre and their Classification phylogénétique du vivant), the term plants is synonymous with Embryophytes. For Wikipedia, the term plants is synonymous with Archaeoplastids (green lineage).
[11] The uncertainty associated with this estimate of plant biomass is relatively small (≈1.2 times). In contrast, the uncertainty associated with the bacterial biomass estimate is much larger (≈9 times) (see ref. [4]).
[12] Erb K.-H. et al. (2017) Unexpectedly large impact of forest management and grazing on global vegetation biomass. Nature 553:73-76
[13] The arthropods are an animal phylum with an organizational plan characterized by a segmented body covered with chitin. They include animals as varied as myriapods (millipedes), crustaceans (krill, crabs…), arachnids (spiders), insects (grasshoppers, flies, bees…), etc.
[14] Kew Botanical Garden (2017) State of the World’s Plants 2017, online
[15] Chapman A.D. (2009) Numbers of Living Species in Australia and the World (Australian Biological Resources Study, Canberra, Australia).
[16] Atkinson A., Siegel V., Pakhomov E.A., Jessopp M.J. & Loeb V. (2009) A re-appraisal of the total biomass and annual production of Antarctic krill. Deep Sea Res. Part I Oceanogr. Res. Pap. 56:727-740.
[17] Sanderson M.G. (1996) Biomass of termites and their emissions of methane and carbon dioxide: A global database. Global Biogeochem. Cycles 10:543-557.
[18] Nematodes are round, tapered worms with a very simple organization. They are found in all environments: marine, freshwater, in soils, in animals or in the aerial parts of plants. Many species are plant parasites (phytophagous). Many species of free-living soil nematodes promote the decomposition of organic matter.
[19] Schultz T.R. (2000) In search of ant ancestors. Proc. Natl. Acad. Sci. USA 97:14028-14029.
[20] Wilson E.O. (2003) The encyclopedia of life. Trends Ecol. Evol. 18:77-80.
[21] Whitman W.B., Coleman D.C. & Wiebe W.J. (1998) Prokaryotes: The unseen majority. Proc. Natl. Acad. Sci. USA 95:6578-6583.
[22] Wake D.B. & Vredenburg V.T. (2008) Colloquium paper: Are we in the midst of the sixth mass extinction? A view from the world of amphibians. Proc. Natl. Acad. Sci. USA 105:11466-11473.
[23] Field C.B., Behrenfeld M.J., Randerson J.T. & Falkowski P. (1998) Primary production of the biosphere: Integrating terrestrial and oceanic components. Science 281:237-240.
[24] Deep subsoils are defined as the area of sediment in the marine subsurface and oceanic crust, and the terrestrial substrate deeper than 8 m, excluding soil.
[25] Most bacteria and archaea on Earth (1.2 × 1030cells) exist in the “big five” habitats: deep ocean basement (4 × 1029), upper ocean sediments (5 × 1028), deep continental basement (3 × 1029), soil (3 × 1029), and oceans (1 × 1029), of which 40-80% of the total number are present in biofilms (a twofold uncertainty). Flemming, H.-C. & Wuertz, S. Bacteria and archaea on Earth and their abundance in biofilms. Nat. Rev. Microbiol. https://doi.org/10.1038/s41579-019-0158-9 (2019)
[26] Johnson H.P. & Pruis M.J. (2003) Fluxes of fluid and heat from the oceanic crustal reservoir. Earth Planet Sci. Lett. 216:565-574.
[27] Macroalgae are a diverse group of multicellular algae, which includes green algae (Chlorophyceae) and red algae (Rhodophyceae) belonging to the plant clade (Archaoplastidae), as well as brown algae (Phaeophyceae), which are part of the protist clade. Bar-On et al[5] first estimated the total biomass of benthic macroalgae, i.e. green, red and brown variants. We note that holoplanktonic algae (algae that spend their entire life cycle in open water) are brown algae (which are protists).
[28] Wigington C.H., Sonderegger D., Brussaard C.P.D. et al. (2016) Re-examination of the relationship between marine viruses and microbial cell abundances. Nat. Microbiol. 1: 15024
[29] Zubkov M.V. (2014) Faster growth of the major prokaryotic versus eukaryoticCO2 fixers in the oligotrophic ocean. Nat. Commun. 5:3776.
[30] Catul V., Gauns M. & Karuppasamy P.K. (2011) A review on mesopelagic fishes belonging to family Myctophidae. Rev. Fish. Biol. Fish. 21:339-354.
[31] Buitenhuis E.T. et al. (2013) MAREDAT: Towards a world atlas of MARine ecosystem DATa. Earth Syst Sci Data 5:227-239.
[32] Kuris A.M. & et al. (2008) Ecosystem energetic implications of parasite and free-living biomass in three estuaries. Nature 454:515-518.
[33] Barnosky A.D. (2008) Colloquium paper: Megafauna biomass tradeoff as a driver of Quaternary and future extinctions. Proc. Natl. Acad. Sci . 105:11543-11548.
[34] Christensen L.B. (2006) Marine mammal populations: Reconstructing historical abundances at the global scale. Fisheries Centre Research Reports 14
[35] Crowther T.W. et al. (2015) Mapping tree density at a global scale. Nature 525:201-205.
The Encyclopedia of the Environment by the Association des Encyclopédies de l'Environnement et de l'Énergie (www.a3e.fr), contractually linked to the University of Grenoble Alpes and Grenoble INP, and sponsored by the French Academy of Sciences.
To cite this article: JOYARD Jacques (April 28, 2023), Distribution of biomass on the planet, Encyclopedia of the Environment, Accessed January 5, 2025 [online ISSN 2555-0950] url : https://www.encyclopedie-environnement.org/en/life/distribution-biomass-planet/.
The articles in the Encyclopedia of the Environment are made available under the terms of the Creative Commons BY-NC-SA license, which authorizes reproduction subject to: citing the source, not making commercial use of them, sharing identical initial conditions, reproducing at each reuse or distribution the mention of this Creative Commons BY-NC-SA license.


