


Role of forests in the planet’s carbon balance
PDF
On a global scale, forests are the main continental carbon sink. However, on a more local scale, while some forests are carbon sinks, others are sources. The net carbon flux depends on various natural and anthropogenic factors. In particular, human activities can both promote carbon storage (protection and expansion of forest areas, fertilizing effect CO2 released by human activities) and cause its release (deforestation, degradation).
- 1. Forests in the global carbon balance
- 2. Distribution of forest carbon stocks
- 3. Increase of the stock: the forest as a carbon sink
- 4. Decrease of the stock: the forest as a source of carbon
- 5. Where are the major forest carbon sinks and sources located?
- 6. Mitigation, adaptation and reforestation
- 7. Take-home messages
1. Forests in the global carbon balance

The forest is, according to the FAO definition [1], an area characterized by a tree cover rate higher than 10% and a tree height higher than 5 meters.
Forests represent an immense stock of carbon via (i) biomass, (ii) soil carbon (in the form of organic matter and carbonate minerals), (iii) dead wood and (iv) litter (the thin layer of dead organic matter above the soil). This stock evolves according to natural factors (deaths of old or diseased trees, growth of others) and anthropogenic factors (deforestation, plantations) (Figure 1). When the stock of carbon stored in the forest increases, the forest is a “carbon sink”, whereas if its stock decreases because carbon is released into the atmosphere, it is a “carbon source”. Depending on the region, the forest can be a source or a sink of carbon. For example, tropical deforestation leads to a significant emission of CO2 into the atmosphere, while the growth of trees contributes on the contrary to capture atmospheric CO2.

- CO2 emissions from fossil fuel use and cement production (EFOS ≈ 9.4 ± 0.5 GtC/year). If we estimate the population of the planet at 8 billion people, this represents an emission of about 1.2 tons of carbon per person per year, with, however, in reality a very large disparity between countries.
- Emissions related to land use changes, mainly deforestation (ELUC ≈ 1.6 ± 0.7 GtC/year). These emissions are uncertain and estimated with inventory models (book-keeping [4]) from lost or gained forest areas.
- Terrestrial (SLAND ≈ 3.4 ± 0.9 GtC/yr) and oceanic (SOCEAN ≈ 2.5 ± 0.6 GtC/yr) CO2 sinks, estimated from an ensemble of 3D numerical ocean carbon cycle models, and from an ensemble of diagnostic models estimating air-sea fluxes from numerous in situ measurements of ocean surface CO2 partial pressure (SOCAT).
At the atmospheric level, the difference between the incoming (EFOS + ELUC= 9.4 + 1.6 = 11.1 GtC/yr) and outgoing (SOCEAN + SLAND= 2.5 + 3.4 = 5.9 GtC/yr) carbon fluxes leads to an accumulation of 5.1 GtC/yr. Thus, of the 9.4 GtC/year released by human activities, 5.1 GtC/year is stored in the atmosphere, i.e. 55% of the emissions.
Forests are estimated to capture between 70 and 100% of the 1.8 GtC/year absorbed from continental surfaces. Non-forested areas (grasslands, crops, tundra, etc.) would therefore capture between 0 and 30% of these 1.8 GtC/year. The uncertainty about the relative contributions of forests and non-forest areas to CO2 sequestration reflects the fact that different methods, with their associated uncertainties, are used to estimate carbon stocks and their variations, and that they do not converge on the same results. In any case, forests are the main carbon sink in the continental environment. In addition, they are also a source of carbon through deforestation. Understanding the role of forests in the carbon cycle is therefore essential for dealing with global warming.
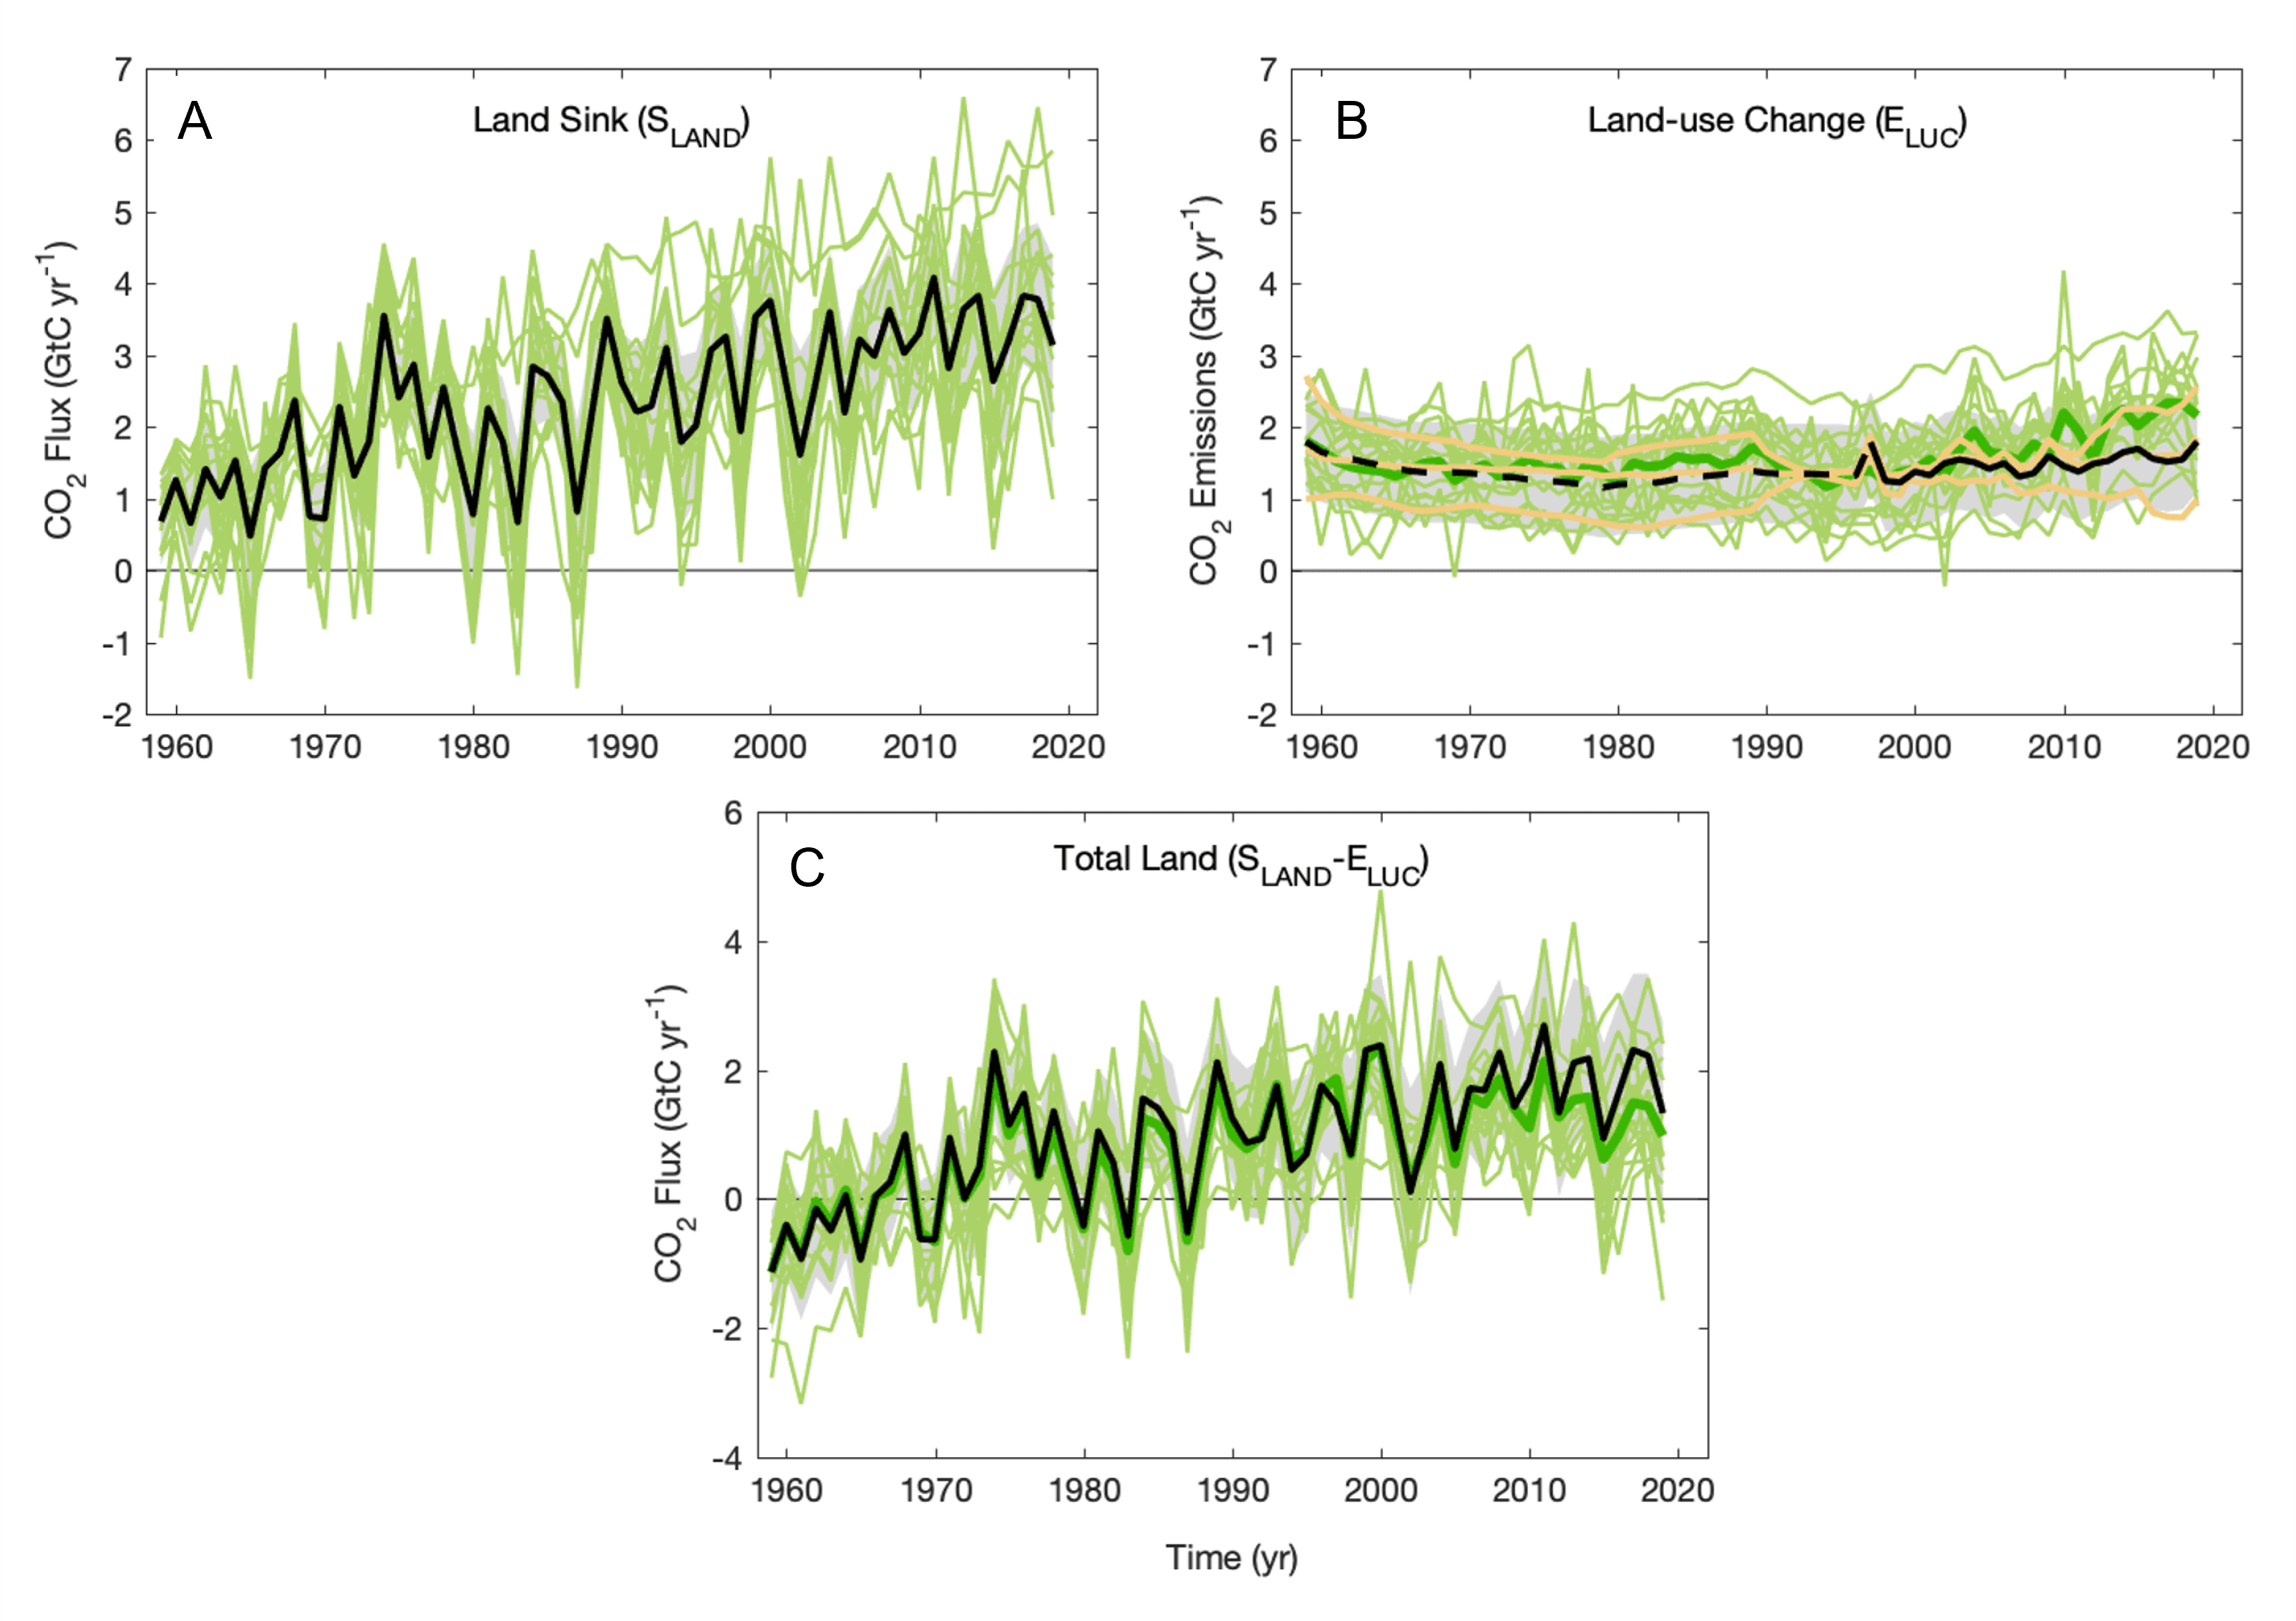
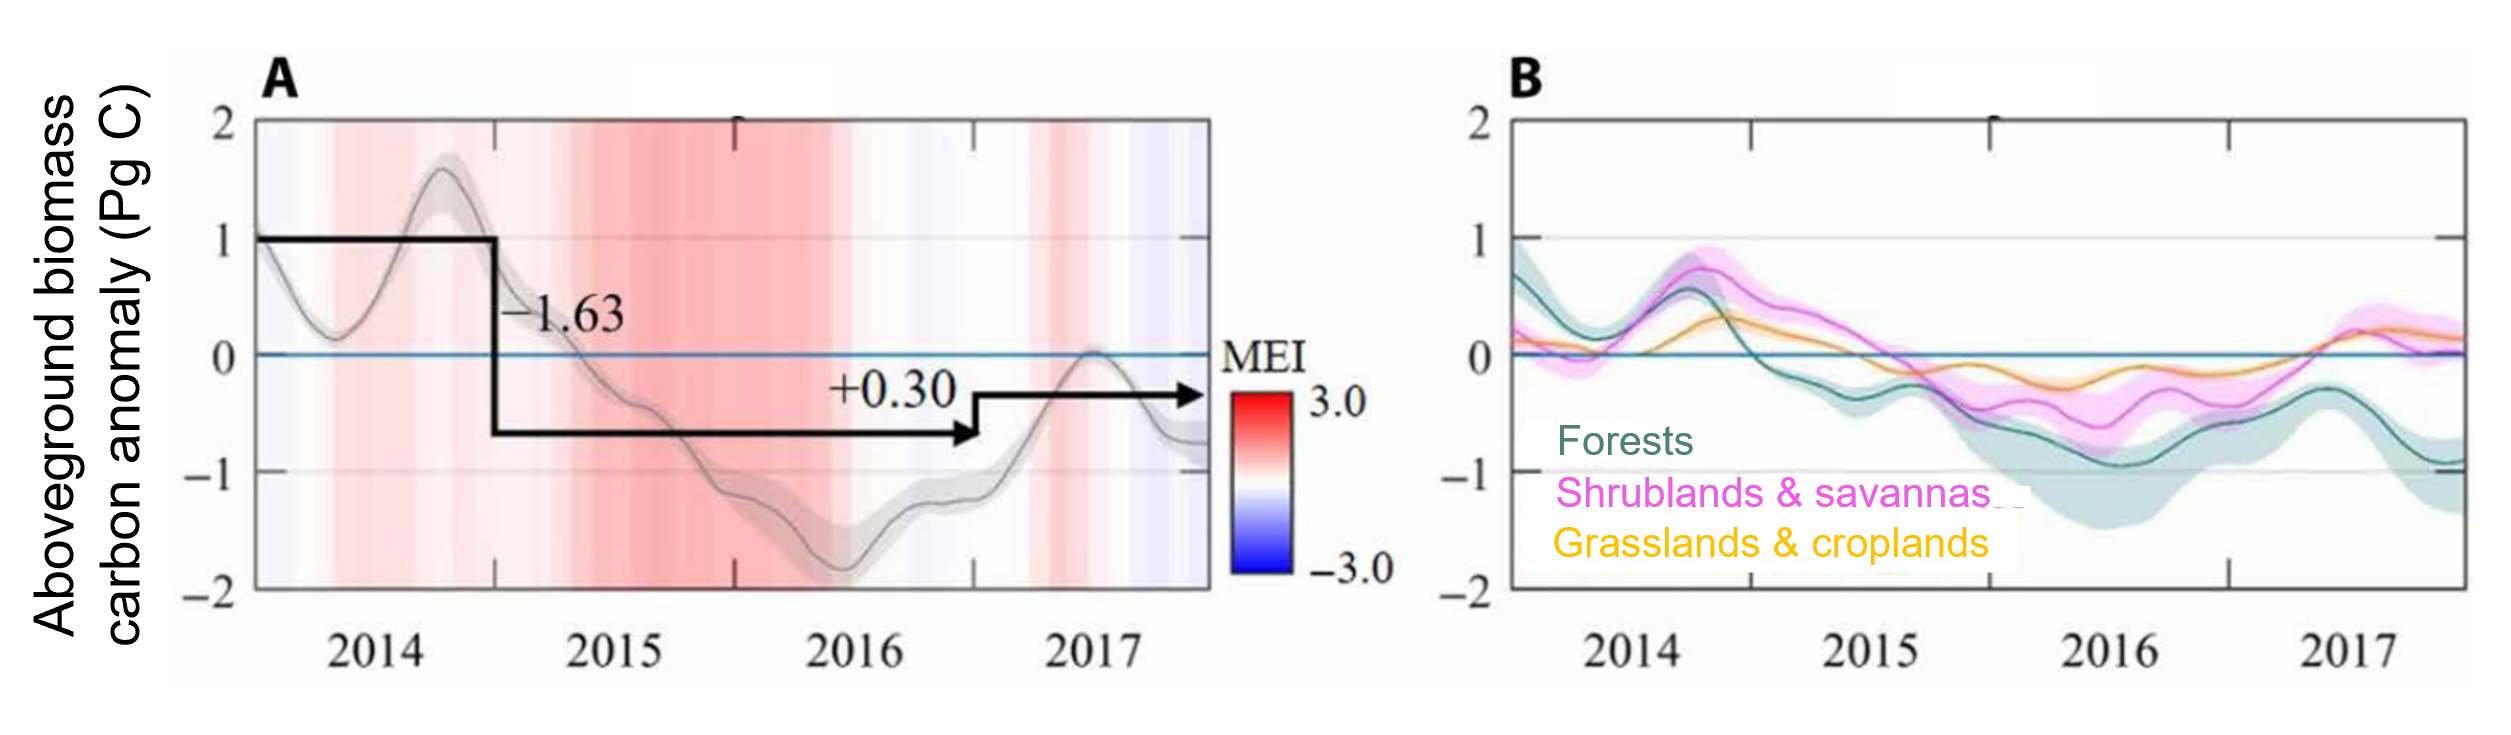
The impact of deforestation (ELUC) was relatively stable, but it is rather increasing in recent years (Figure 3). The terrestrial sink (SLAND) is increasing, possibly related to replanting efforts and the fertilizing effects of CO2 , but tended to stagnate in recent years. The total residual terrestrial carbon sink (SLAND– ELUC) is roughly stable over the last two decades (Figure 3).
Before looking at changes in carbon stocks, whether positive (forest = sink) or negative (forest = source), let us first consider the distribution of these stocks on a global scale.
2. Distribution of forest carbon stocks
Forest carbon stocks correspond to the carbon stock present in the vegetation (above and below ground), the soil, dead wood and litter. Forests cover about 3,900 million hectares of the planet and are distributed in three main geographical domains: tropical (about 50%), boreal (1,100 Mha) and temperate (750 Mha) [5] (see Table S2 of this reference [5]).
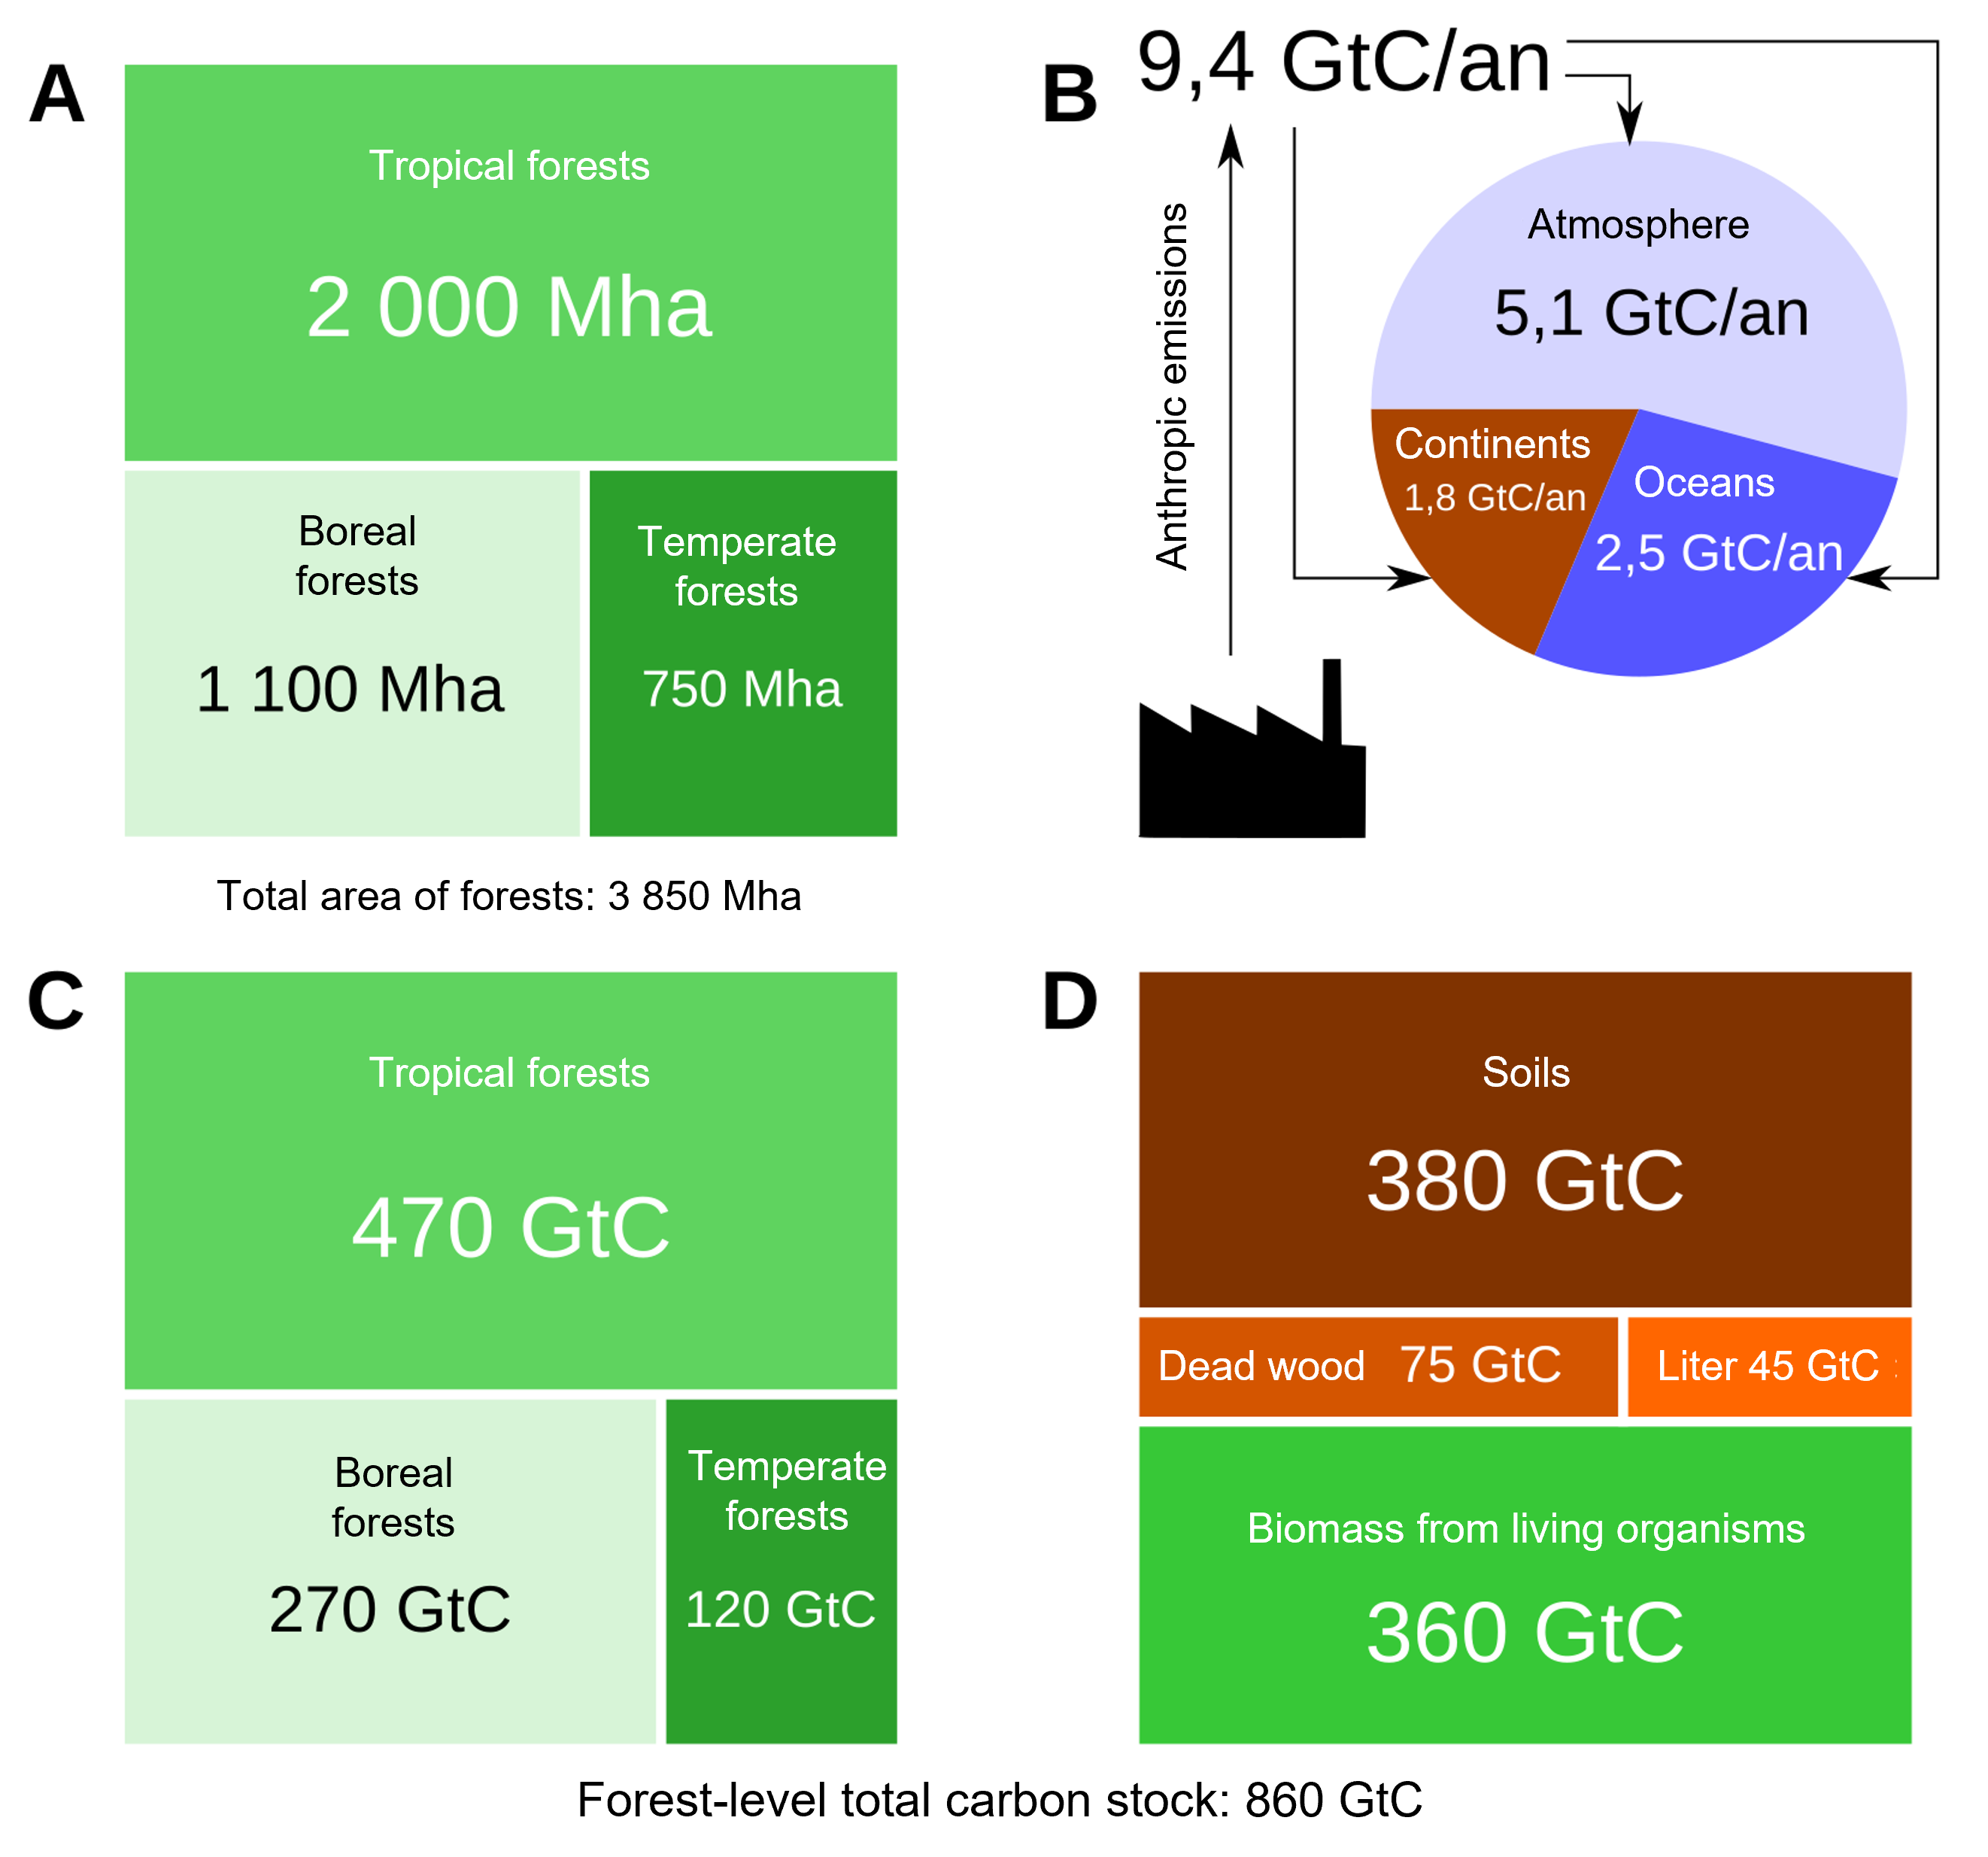
Stock density is similar in tropical and boreal forests (242 vs. 239 MgC.ha–1 or tonne C. ha–1), but is 60% lower in temperate forests (about 150 MgC. ha–1 or tonne C. ha–1). A fundamental difference in the structure of carbon stocks in tropical and boreal forests should be noted. In tropical forests, the stocks are mainly located in the biomass (56%) against 32% for the soil, whereas in boreal forests, they are mainly in the soil (60%) against 20% for the biomass. Thus, if we consider only the living biomass (above and below ground), out of a total of 360 GtC, the tropics account for about 70% (260 GtC) of the carbon stocks of the world’s forests, of which about 40% (140 GtC) is in the American tropics alone and 25% (93 GtC) if we consider only the above ground living biomass of the Amazon (Figure 5) [6].
As mentioned above, the carbon stock of forests changes according to climate, human activities, etc., and these changes can be positive (carbon accumulates in the forest, called a sink) or negative (called a source). Let’s consider the main factors behind these changes, whether they are positive or negative.
3. Increase of the stock: the forest as a carbon sink

Even if the total biomass (above and below ground) of a forest remains relatively stable, the forest can accumulate carbon in the litter layer that can feed the soil carbon pool over the long term. Thus, the litter layer and soil are important terms in the carbon balance of boreal forests because the rate of decomposition is low.
Following Pugh et al [7], we distinguish forests into two broad classes (i) regrowth forests and (ii) old-growth and intact forests (defined by age greater than 140 years). These authors estimate a carbon sink of 1.30 GtC/year for regrowth forests and 0.85 GtC/year for old growth forests. In total, they estimate a global forest sink of about 2.15 GtC/year, which is comparable in magnitude to the residual terrestrial sink (1.8 GtC/year) estimated by the Global Carbon Project.
3.1. Old and intact forests in pseudo-equilibrium
These forests correspond to forests that have not undergone (in theory) any human intervention for many decades: they are assumed to be relatively “intact”. These are essentially tropical forests, either protected or still relatively inaccessible to human activities.
In a very old forest, in pseudo-equilibrium with its environment, the carbon stock remains relatively stable or, under certain specific conditions, slowly increases with an accumulation of carbon in the soil. Indeed, the accumulation of carbon during the growth of trees is compensated by the emission of carbon linked to the decomposition of dead wood and litter (via autotrophic respiration in the litter and the soil), which results from the fall of leaves, branches and a natural mortality of the oldest trees (renewal of the biomass). As the decomposition of dead wood debris is not instantaneous, carbon emissions to the atmosphere from tree mortality are not immediate: there is a buffering effect associated with this decomposition over several years [3], [8].

For example, a highly cited article by Luyssaert et al [9] challenges the idea that old-growth forests are carbon neutral. They estimate from a few sites that old-growth and intact forests in temperate and boreal regions constitute a significant carbon sink (about 4.6 GtC/year). This value would be strongly overestimated according to Gundersen et al [10], who propose a value of 1.6 GtC/year for the old-growth forests (> 200 years) of these regions. This second estimate remains high, as it is of the same order of magnitude as the global terrestrial sink (see section 1), and does not take into account losses by fire and insects. Furthermore, Pugh et al [8] estimate that there are very few old-growth forests in temperate and boreal regions, which confirms that the results of Luysseart et al. would be strongly biased by the inclusion of “managed” forests in their study [10].
Also of note are two recent reference studies in the tropics that include most of the “intact” forests. Brienen et al [11], based on a very large in situ database of “intact” sites, find that the Amazon forest is indeed a carbon sink, but that this sink is declining, linked to a decrease in productivity and an increase in mortality. They conclude that their results contradict those of models (generally taking into account the fertilizing effect of CO2, but not that of mortality) that predict a continuous and intense carbon sink of tropical forests. The study by Hubau et al [12] confirms that we have passed the peak of carbon sink in tropical forests. The sink in the biomass of intact Amazonian forests continues to decline rapidly, while that of Africa (about 0.66 MgC/ha/yr or tonne C/ha/yr) is only beginning to decline (mortality being lower than in Amazonia because African tropical forests are more adapted to drought and high temperature events).
In conclusion, it appears that old-growth and intact forests, found mainly in tropical forests, are a carbon sink. However, it should be noted that this “sink” effect is possibly due to the fertilizing role of CO2 and that, if it exists on a large scale, it is probably small and declining due to increasing tree mortality associated with drought and increasing temperatures.
3.2. Regrowth forest
3.2.1. General case

- regions where the forest is managed (Western Europe, United States, Canada) including very large regions where a generally rather young forest is developing in connection with massive plantations (e.g. China);
- the abandonment of cultivation or less intensive forest management (Western Russia);
- “natural” secondary forests that regrow after fires, degradation or deforestation (mainly in the tropics and boreal regions).
3.2.2. Special case of managed forests
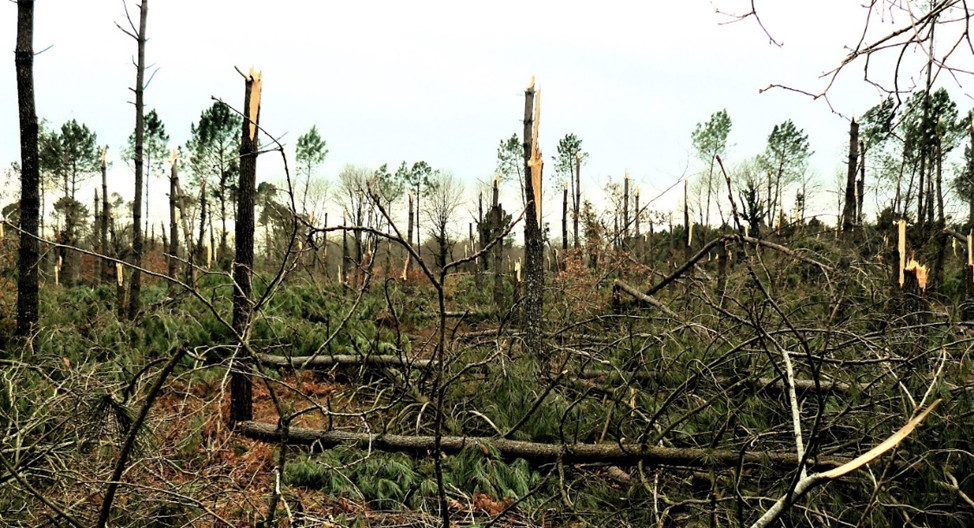
Among the regrowth forests, we present here the special case of managed forests. A well-managed forest that is regularly cut by plots will have a relatively stable biomass stock over time, unless management tends to increase stand density. But such a forest can also be a carbon sink if the cuttings are used to make durable products such as housing components (framing, siding, furniture). This carbon storage is not eternal and, eventually, these products will add to the atmospheric carbon stock. However, they can have a delaying effect over decades. This buffering effect is increased if the use and life span of these wood products increases. Durability is particularly important for species that are highly resistant to pest attacks (larch, chestnut, black locust, etc.) and require little or no chemical treatment. These species should therefore be favored whenever conditions are suitable. A forest is well managed if the harvests respect the sustainability of the forest and avoid overexploitation. This also implies preserving the biodiversity that makes the forest more resilient to disturbances (pest attacks, storms, fires, etc.). Thus, while monospecific crops may appear more profitable in the short term, they are more exposed to major risks (e.g., the storms – including Klaus in 2009, Figure 8 – that ravaged the Landes forest).
4. Decrease of the stock: the forest as a source of carbon
Many factors can cause a decrease in forest carbon stocks.
4.1. Deforestation
Deforestation corresponds to the transformation of a forest surface into another type of surface over the long term: area of crops, pastures, shrubby wasteland, urban elements, etc. This does not include forest cutting conducted as part of long-term forest management, which has only transitory effects. More generally, deforestation is classified as land-use and cover-change (LUCC). As we have seen, this term is one of the main ones in the global carbon balance: deforestation leads to CO2 emissions into the atmosphere of about 1.6 ± 0.7 GtC/year. This term, noted ELUC, corresponds to the algebraic sum of carbon fluxes going out to the atmosphere (tree felling and soil respiration after deforestation) and carbon fluxes coming into the biosphere (regrowth of forests after changes in land use, e.g. on abandoned cropland).
4.2. Forest degradation
5. Where are the major forest carbon sinks and sources located?
5.1. Study methods
First, it should be noted that there are still large uncertainties in estimating and quantifying forest carbon sources and sinks at the global scale.
- on remote sensing data [19],[20] via optical or radar observations, but these measurements saturate for high forest biomass values. There is therefore a debate in the community on the validity of these estimates [21].
- on lidar data (which measure the height of trees which is well related to their biomass) such as those provided by the GEDI satellite [22]; but several years of GEDI observations are needed to cover the whole planet. Thus, if global maps of forest aboveground biomass are available [23],[24] they do not allow yet a dynamic monitoring of stock changes.
Estimates of these changes are based on inventory work [13] that relies on monitoring data of changes in land use types (including that of the FAO) that are weighted by estimates of the carbon stocks of these different land use types. However, the quality of the inventory data varies greatly from one country to another, and the used biomass estimates are still rather coarse.
Very recently, passive microwave observation data (L-VOD vegetation index at long microwave wavelength, about 20 cm) have made it possible to map the major continental carbon sinks and sources in terms of aboveground biomass [25]. Products based on optical observations are also used to estimate changes in forest canopy cover [26] (see Figure 12 and Focus Forest Carbon & Biomass).
5.2. Main results
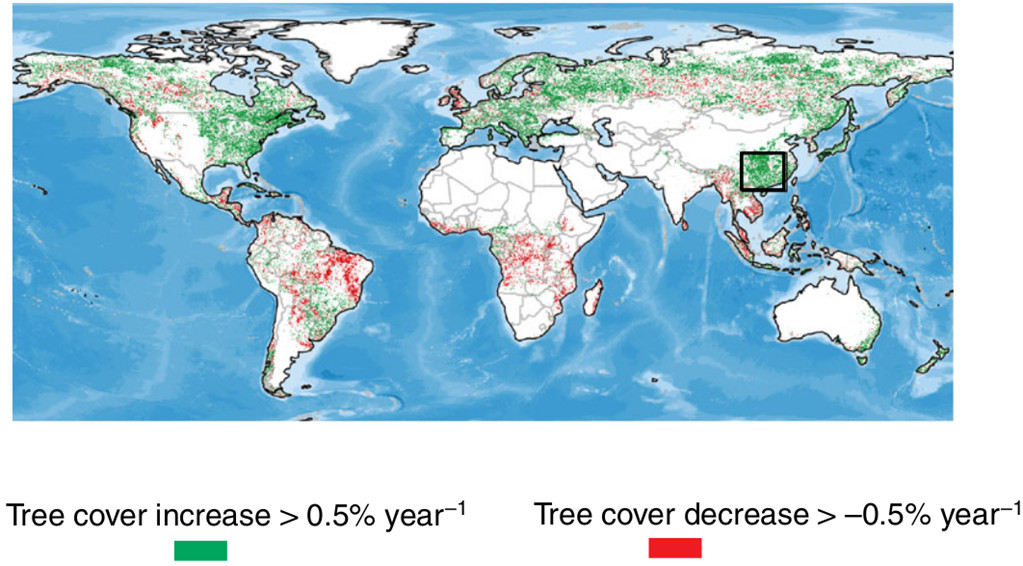
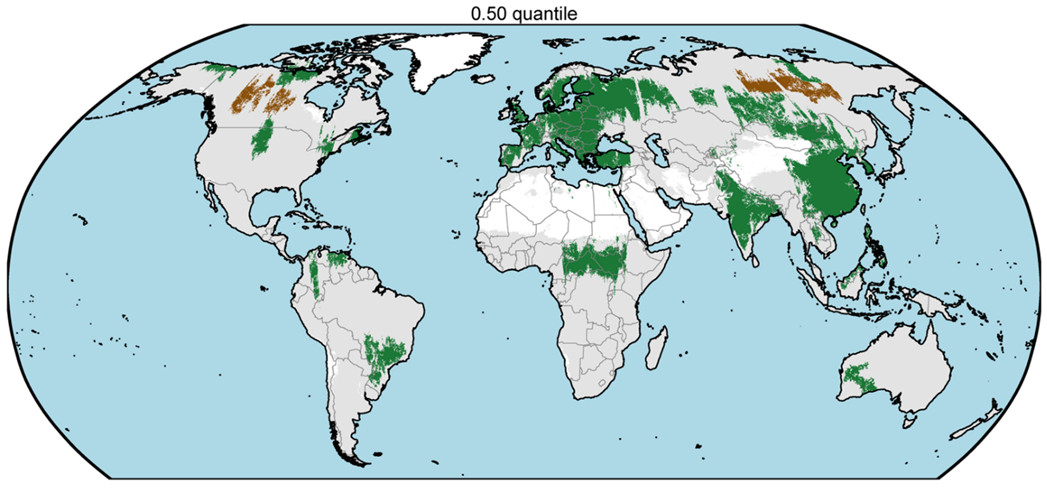
Here we outline some very recent results, some of which are still under analysis. As mentioned earlier, regrowth forests are important carbon sinks. For example, the reforestation program conducted in China for several years, particularly in the south of the country, is responsible for a carbon sink of about 0.15 GtC/year. The western part of Russia also sequesters a lot of carbon, probably due to the abandonment of some cultivated areas and a decrease in forest exploitation. There are also sinks distributed throughout the tropics in connection with (i) secondary forests, i.e. those growing on formerly exploited areas, (ii) a decrease in degradation linked to certain political contexts (e.g. civil war in the Central African Republic), (iii) more humid conditions that are conducive to the growth of forests (south-eastern Africa and central-eastern South America).
It should be noted that these regions generally correspond to the so-called greening regions highlighted by optical satellites (Figure 13) [27]. However, the greening phenomenon does not necessarily reflect a carbon sink. For example, following a fire or a forest cut, low vegetation can recover very quickly and optical satellites measure greening via vegetation indices (NDVI, leaf area index), whereas L-VOD microwave images, which penetrate the vegetation and probe the entire biomass, do indicate a drop in carbon stocks.
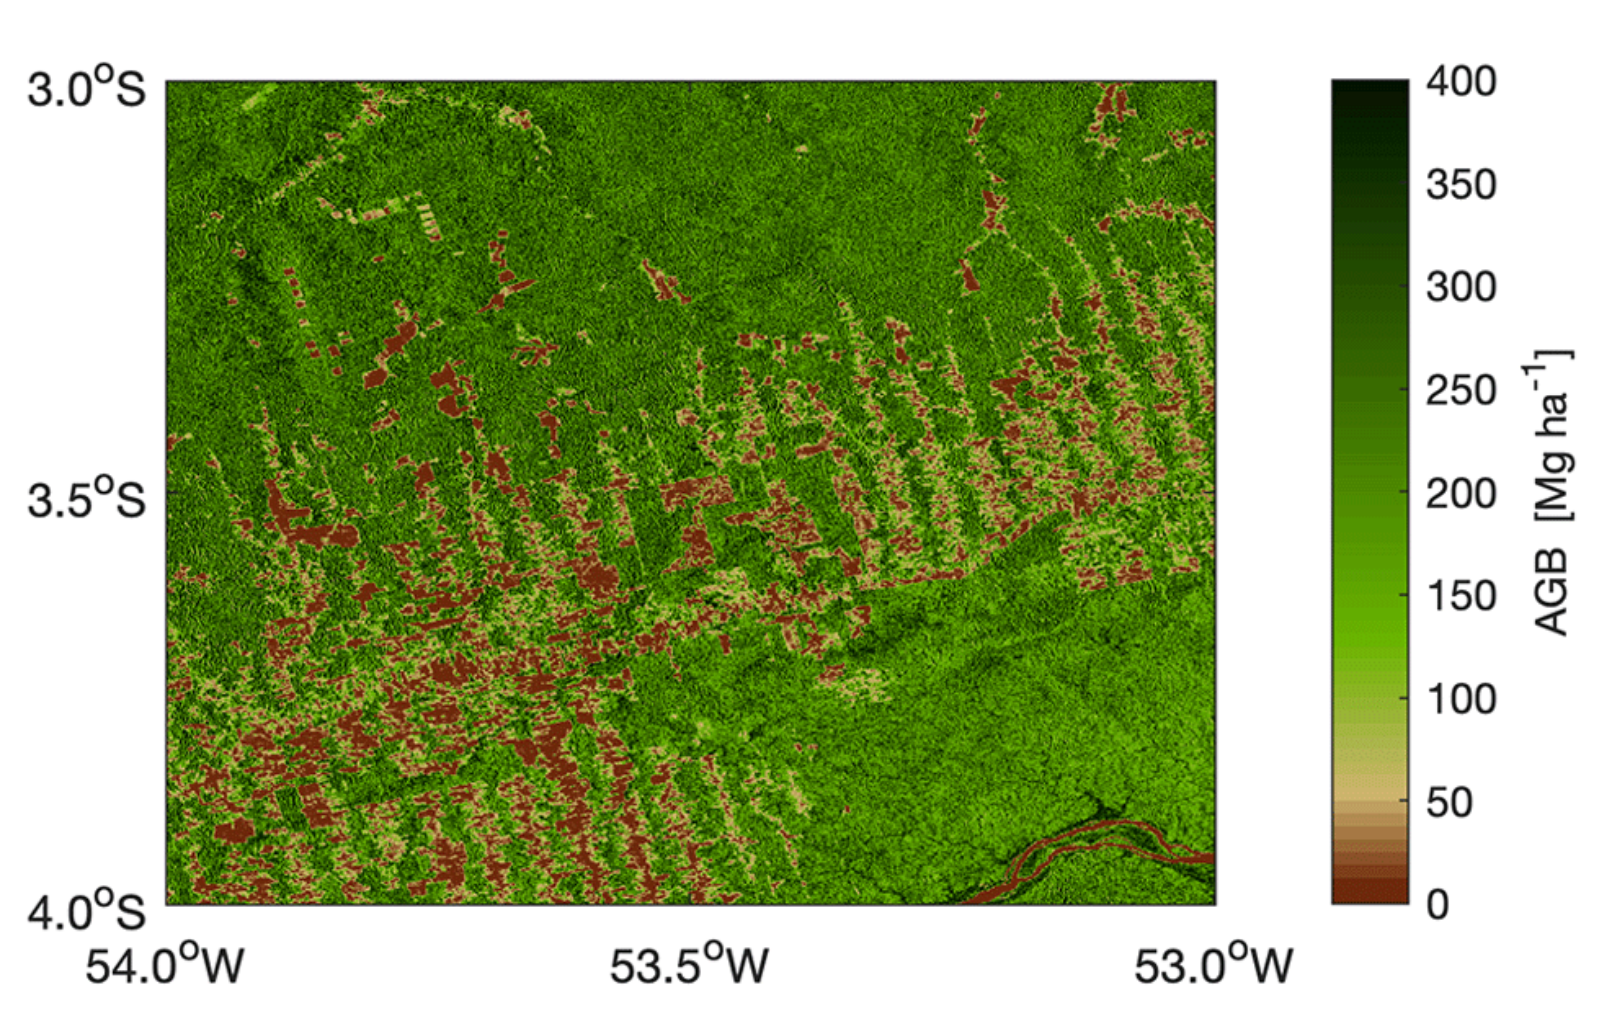
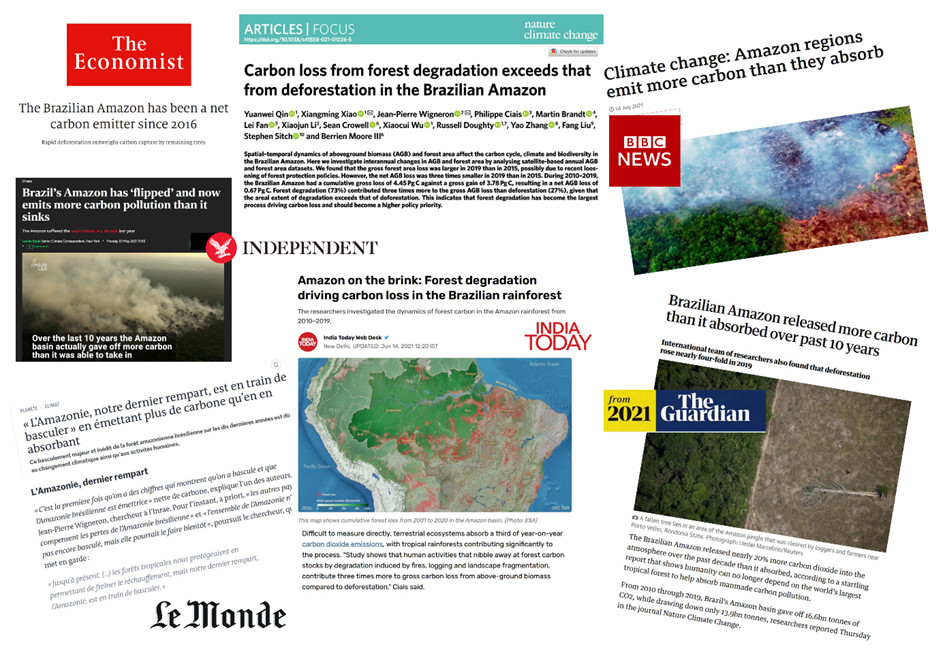
More recently, a study showed that the Brazilian part of the Amazon was no longer a sink, but a source of carbon over the last decade [30]. The news, which is very symbolic, went around the world and was reported in many newspapers (Figure 14). The article also shows that the impact of hidden degradations (“hidden”, as they are generally not detected by optical satellites) exceeds that of deforestation.
6. Mitigation, adaptation and reforestation
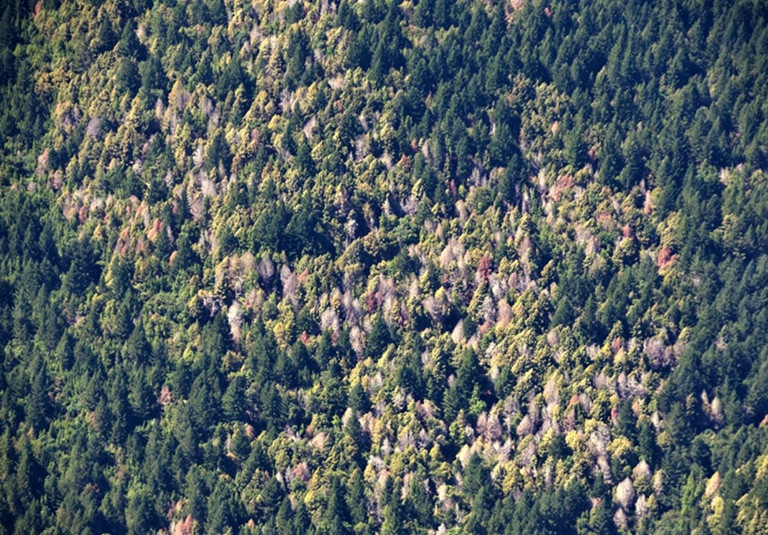
Adaptation of forests aims to make them less vulnerable to climate change in order to prevent them from becoming carbon sources. One of the key elements is adaptation to high temperatures and drought. Indeed, climate change is so rapid that forests do not have time to adapt, especially through changes in species distribution where those better adapted to a hot and dry climate would replace species that are not adapted to the new conditions. The latter suffer mortality and dieback due to insect or fungal attacks and abiotic damage (spring frost and summer drought). In France, the most affected species are beech, chestnut, some oak and pine species as well as spruce which will disappear from regions where they are no longer adapted. Conversely, some species are thriving, such as the holm oak (Figure 15) in Aquitaine, which is gradually replacing the pedunculate oak, which is less tolerant of water stress, in some places [31].
One of the solutions to accelerate the adaptation of forests is to replant with species and varieties better adapted to current and future climatic conditions (see, for example, the RENEssences project of the French National Forestry Office).

For example, massive replanting can put pressure on water resources, as trees consume a lot of water, which depletes soil reserves and can make reforestation unsustainable [32]. It is therefore preferable to replant in areas where water availability is sufficient and where forests are disappearing due to anthropogenic disturbances (deforestation, degradation, fires). Particularly noteworthy are large areas of the Amazon basin and Russia.
Moreover, replanting has a very negative carbon footprint because of the energy spent to grow the plants, the use of mechanical equipment, road construction, etc. Moreover, the planted trees can suffer massive mortality episodes (due to lack of irrigation) and the plantations are often done with a single species, which is not very conducive to the biodiversity of the forest. The latter is however a guarantee of resilience of forests to biotic and climatic disturbances. Thus, when conditions are favourable, for example in the case of a large thinning in a tropical forest, it is largely preferable to leave room for natural regeneration. Natural regeneration is generally very favorable to biodiversity and does not require human intervention, synonymous with greenhouse gas emissions. In summary, rather than replanting, the priority should therefore often be given to the protection of huge forest areas (especially in the tropics and in Russia), where soil moisture conditions are favorable to tree growth (and natural regeneration) and where carbon stocks are decreasing due to lack of protection. If large international companies really want to invest in a sustainable and selfless way, this is probably the best choice.
7. Take-home messages
- Forests represent a huge carbon stock through (i) biomass, (ii) soil carbon, (iii) dead wood and (iv) litter.
- Depending on the region, the forest can be a source or a sink of carbon. Tropical deforestation leads to a significant emission emission of CO2 into the atmosphere, while the growth of trees contributes on the contrary to capture atmospheric CO2.
- Forests are estimated to capture between 70% and 100% of the 1.8 GtC/year absorbed by continental surfaces. Non-forested surfaces (grasslands, crops, tundra, etc.) would capture between 0 and 30% of these 1.8 GtC/year.
- The density of stocks is similar in tropical and boreal forests; but in tropical forests, stocks are mainly located in biomass (56%) against 32% for the soil; vs. 20% and 60% for boreal forests.
- Out of a total of 360 GtC of living biomass (above and below ground), the tropics account for about 70% (260 GtC) of the carbon stocks of the world’s forests, of which about 40% (140 GtC) is in the American tropics alone and 25% (93 GtC) if we consider only the above ground living biomass of the Amazon.
- Old and intact forests (mainly in tropical forests), constitute a carbon sink, but this “sink” effect is probably weak and declining due to increasing tree mortality linked to drought and increasing temperatures.
- Many factors can cause a decrease in forest carbon stocks, such as deforestation or forest degradation. Thus, over the last decade, the Brazilian part of the Amazon is no longer a sink, but a source of carbon.
- The regrowth forests are important carbon sinks, but the replanting operations are a very important source of carbon because of the energy spent for the cultivation of the plants, the use of mechanical machinery, the construction of roads, etc.
- When conditions are favorable, it is much better to leave room for natural regeneration, which is generally very favorable to biodiversity and does not require replanting.
- Rather than replanting, priority should often be given to protecting large areas of forest (especially in the tropics and Russia), where soil moisture conditions are favorable for tree growth (and natural regeneration) and where carbon stocks are decreasing due to lack of protection.
This article (in french) was originally published in December 2021 by Planet Vie under a Creative Commons license: Rôle des forêts dans le bilan de carbone de la planète. It was edited by Mr. Pascal Combemorel, Editorial Manager of Planet-Vie.
Notes and references
Cover image. Image by JoeBreuer from Pixabay.
[1] Qin Y., Xiao X., Wigneron J.-P. et al, Annual Maps of Forests in Australia from Analyses of Microwave and Optical Images with FAO Forest Definition, Journal of Remote Sensing, AAAS, 2021, Article ID 9784657, https://doi.org/10.34133/2021/9784657
[2] Friedlingstein, P., et al, Global Carbon Budget 2020, Earth Syst. Sci. Data, 12, 3269-3340, https://doi.org/10.5194/essd-12-3269-2020, 2020.
[3] Le Quéré, C. et al. Global Carbon Budget 2016. Earth Syst. Sci. Data 8, 605-649 (2016), https://doi.org/10.5194/essd-8-605-2016
[4] Houghton, R. A. & Nassikas, A. A. Global and regional fluxes of carbon from land use and land cover change 1850-2015. Glob. Biogeochem. Cycles 31, 456-472 (2017), https://doi.org/10.1002/2016GB005546
[5] Pan, Y. D. et al. A large and persistent carbon sink in the world’s forests. Science 333, 988-993 (2011), https://doi.org/10.1126/science.1201609
[6] Malhi Y. et al. (2006), The regional variation of aboveground live biomass in old-growth Amazonian forests. Global Change Biology, 12: 1107-1138. https://doi.org/10.1111/j.1365-2486.2006.01120.x
[7] Pugh T. et al, Role of forest regrowth in global carbon sink dynamics, Proc. Nat. Acad. Sci USA 116 (10) 4382-4387 (2019) https://doi.org/10.1073/pnas.1810512116
[8] Yang, H et al., Coarse woody debris is buffering mortality-induced carbon losses to the atmosphere in tropical forests, Environ. Res. Lett. 16 (2021) 011006, https://doi.org/10.1088/1748-9326/abd58a
[9] Luyssaert, S., Schulze, ED., Börner, A. et al . Old-growth forests as global carbon sinks. Nature 455, 213-215 (2008). https://doi.org/10.1038/nature07276
[10] Gundersen, P., Thybring, E.E., Nord-Larsen, T. et al. Old-growth forest carbon sinks overestimated. Nature 591, E21-E23 (2021). https://doi.org/10.1038/s41586-021-03266-
[11] Brienen, R. J. W. et al. Long-term decline of the Amazon carbon sink. Nature 519, 344-348 (2015). https://doi.org/10.1038/nature14283
[12] Hubau, W., Lewis, S.L., Phillips, O.L. et al. Asynchronous carbon sink saturation in African and Amazonian tropical forests. Nature 579, 80-87 (2020). https://doi.org/10.1038/s41586-020-2035-0
[13] Santoro, M. et al, The global forest above-ground biomass pool for 2010 estimated from high-resolution satellite observations, Earth Syst. Sci. Data, 13, 3927-3950, https://doi.org/10.5194/essd-13-3927-2021, 2021.
[14] Hansen, M. C., Potapov, P. & Tyukavina, A. Comment on ‘Tropical forests are a net carbon source based on aboveground measurements of gain and loss’. Science 363, eaar3629 (2019), https://doi.org/10.1126/science.aar3629
[15] Ygorra, B., Frappart F., Wigneron J.-P. et al, Monitoring loss of tropical forest cover from Sentinel-1 time-series: A CuSum-based approach, International Journal of Applied Earth Observations and Geoinformation 103 (2021) 102532, https://doi.org/10.1016/j.jag.2021.102532, 2021.
[16] Cobb, R. C., Haas, S. E., Kruskamp, N., Dillon, W. W., Swiecki, T. J., Rizzo, D. M., et al. (2020). The magnitude of regional-scale tree mortality caused by the invasive pathogen Phytophthora ramorum. Earth’s Future, 8, e2020EF001500. https://doi.org/10.1029/2020EF001500
[17] Wigneron, J.-P., L. Fan, P. Ciais, et al. Tropical forests did not recover from the strong 2015-2016 El Niño event, Science Advances, vol. 6, no. 6, eaay4603, 2020, https://doi.org/10.1126/sciadv.aay4603
[18] Chave, J. et al. Improved allometric models to estimate the aboveground biomass of tropical trees. Glob. Chang. Biol. 20, 3177-3190 (2014).
[19] Baccini, A. et al. Tropical forests are a net carbon source based on aboveground measurements of gain and loss. Science 358, 230-234 (2017), https://doi.org/10.1126/science.aam5962
[20] Houghton, R. A. & Nassikas, A. A. Global and regional fluxes of carbon from land use and land cover change 1850-2015. Glob. Biogeochem. Cycles 31, 456-472 (2017), https://doi.org/10.1002/2016GB005546
[21] Hansen, M. C. et al. High-resolution global maps of 21st-century forest cover change. Science 342, 850-853 (2013). https://doi.org/10.1126/science.1244693
[22] Dubayah, R. et al. The Global Ecosystem Dynamics Investigation: high-resolution laser ranging of the Earth’s forests and topography. Sci. Remote Sens. 1, 100002 (2020), https://doi.org/10.1016/j.srs.2020.100002
[23] Baccini, A. et al. Estimated carbon dioxide emissions from tropical deforestation improved by carbon-density maps. Nat. Clim. Chang. 2, 182-185 (2012). https://doi.org/10.1038/nclimate1354
[24] Saatchi, S. S. et al. Benchmark map of forest carbon stocks in tropical regions across three continents. Proc. Natl Acad. Sci. USA 108, 9899-9904 (2011). https://doi.org/10.1073/pnas.1019576108
[25] Wigneron, J.-P., Li, X., et al. SMOS-IC data record of soil moisture and L-VOD: historical development, applications and perspectives, Remote Sens. Env. 254, 112238, https://doi.org/10.1016/j.rse.2020.112238, 2021.
[26] Tong, X., M. Brandt et al, Forest management in southern China generates short term extensive carbon sequestration, Nature Comm. 11:129, 2020, https://doi.org/10.1038/s41467-019-13798-8
[27] Cortés, J. et al, Where are global vegetation greening and browning trends significant? Geophysical Research Letters, 48, e2020GL091496. https://doi.org/10.1029/2020GL091496
[28] Mitchard, E.T.A. The tropical forest carbon cycle and climate change. Nature 559, 527-534 (2018). https://doi.org/10.1038/s41586-018-0300-2
[29] Fan, L., J.-P. Wigneron, P. Ciais et al. Satellite observed pantropical carbon dynamics, Nature Plants, 5, 944-951, July 2019, https://doi.org/10.1038/s41477-019-0478-9.
[30] Qin, Y. et al. (2021). Carbon loss from forest degradation exceeds that from deforestation in the Brazilian Amazon, Nature Climate Change, 11, 442-448, https://doi.org/10.1038/s41558-021-01026-5
[31] Urli, M., Lamy, JB., Sin, F. et al . The high vulnerability of Quercus robur to drought at its southern margin paves the way for Quercus ilex. Plant Ecol 216, 177-187 (2015). https://doi.org/10.1007/s11258-014-0426-8
[32] Tong, X., M. Brandt et al, Forest management in southern China generates short term extensive carbon sequestration, Nature Comm, 11:129, 2020, https://doi.org/10.1038/s41467-019-13798-8
The Encyclopedia of the Environment by the Association des Encyclopédies de l'Environnement et de l'Énergie (www.a3e.fr), contractually linked to the University of Grenoble Alpes and Grenoble INP, and sponsored by the French Academy of Sciences.
To cite this article: WIGNERON Jean-Pierre, CIAIS Philippe (January 5, 2025), Role of forests in the planet’s carbon balance, Encyclopedia of the Environment, Accessed March 30, 2025 [online ISSN 2555-0950] url : https://www.encyclopedie-environnement.org/en/life/role-forests-planet-carbon-balance/.
The articles in the Encyclopedia of the Environment are made available under the terms of the Creative Commons BY-NC-SA license, which authorizes reproduction subject to: citing the source, not making commercial use of them, sharing identical initial conditions, reproducing at each reuse or distribution the mention of this Creative Commons BY-NC-SA license.