Introduction to weather forecasting

PDF
Encyclopédie environnement - prévision météorologique - couverture

What time will we have next weekend? What are the risks of storms, thunderstorms and heat waves in the coming days? Meteorological services are now able to answer these questions in a useful way. But what mechanism is behind these forecasts? This article presents an overview of the functioning of Numerical Weather Forecasting centres that exist in various countries around the world, and introduces the essential concepts developed in the other articles of this sub-section.

1. Introduction

ARPEGE model quality forecasts
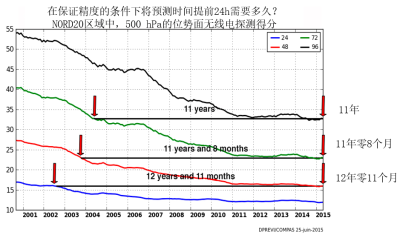
Figure 1. Evolution of the quality of the forecasts of the ARPEGE model over the last 15 years. The score shown is the mean square error of the geopotential forecasts at 500hPa (geopotential is the precise altitude of the 500 hPa pressure surface, which is approximately 5000 m), averaged over the entire Northern Hemisphere north of 20° latitude, for the lead-times 24, 48, 72, and 96 hours. There has been a steady improvement in quality, which has resulted in an improvement of about 24 hours in 11 to 12 years. [Source: © Météo-France]
The remarkable improvement in the quality of weather forecasts is one of the great successes of environmental science in the 20th century, which continues at a sustained pace at the beginning of the 21st century (see Figure 1 and Bauer et al, 2015). This is due to the progress of numerical prediction systems and the increasing number and variety of observations of the state of the atmosphere and related media (ocean, soils, vegetation, cryosphere), including observations from Earth observation satellites. The rapid development of supercomputers has been one of the keys to this success, which has also required significant scientific work.

Each country in the world has a National Meteorological Service (NMS), whose mission is to make regular observations of the atmosphere and to issue forecasts for government, industry and the public. But only the most advanced countries have Numerical Weather Prediction (NWP) centres, whose products are also distributed to other countries, in exchange for their observations, within the framework of the World Meteorological Organization [1].

Among the main NWP centres outside Europe are those in the United States, Canada, Japan, Korea, China, Russia, Australia, India, Morocco, South Africa and Brazil. In Europe, only France, the United Kingdom and Germany make numerical forecasts for the entire globe, while the other countries have NWP centres covering only regional areas. The European countries have also come together in a “super-centre” [2], which is responsible for providing them with medium-range numerical forecasts.

2. The different functions of NWP centres

Encyclopédie environnement - prévision météorologique - systèmes observations météorologie opérationnelle - observation meteorology
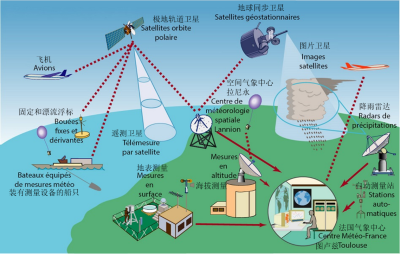
Figure 2. Observation systems used in operational meteorology [Source: WMO/Météo-France]
The organization of NWP centres varies from one country to another, but there are some shared major functions described below. The first important function is the reception of observations. Observations means any numerical data characterizing the state of the atmosphere or related media. These observations are very varied (see Figure 2), we will note in particular:

  • Surface level measurements made by Meteorological Services worldwide, either at land stations or on offshore buoys;
  • Altitude measurements made by ascending balloons (radiosondes) or meteorological radars [3];
  • Measurements made by meteorological satellites or, more generally, Earth observation satellites (there are currently more than fifteen such satellites);
  • Measurements taken on board commercial aircraft or vessels.

The composite observing system thus constituted represents the bulk of the cost of meteorology, and this cost is shared by all countries in the world. The fact that different countries freely exchange observations (even sometimes in times of war) is one of the most remarkable achievements of meteorology.

The volume of these data is considerable (tens of millions of observations every day, spread over the entire globe) and every effort is made to ensure that they reach the NWP centres as quickly as possible, usually less than three hours after the measurement is made. These centres must have powerful telecommunication and information processing systems to receive, process and archive observations as they become available.

The second function is the critical examination of observations to detect possible false (if a measurement system is faulty), redundant, or biased observations. This is usually done by comparing neighbouring observations, or by comparing each observation with a recent forecast of the same parameter (if the observation is very different from the forecast, it will tend to be considered suspicious unless it is confirmed by neighbouring and independent observations). Any anomalies found on certain observations are reported to the originating services, which can then take corrective action.

The third function consists in producing, from the varied and heterogeneous set of recent observations, a “state” of the atmosphere in the form of mathematical fields that can be used to start the forecast model. This task of producing the initial state of the forecast is called Data Assimilation (see Meteorological Data Assimilation). The natural aim is to produce the initial state as close as possible to reality at a given time, but this is very difficult because the observations are all affected by small uncertainties, are not synchronous and do not cover all points on the globe. It is therefore necessary to interpolate spatially and temporally and to search for the “most probable” initial state taking into account all the available information.

The fourth function is the forecast itself, which is carried out by a numerical model of the atmosphere (see Weather forecasting models). The model solves the equations of fluid dynamics and calculates the successive states to project itself in time at 24h, 48h, etc… The main NWP centres actually use several forecast model configurations: a global version for a general forecast with a lead-time of several days, then one or more “regional” versions covering areas of particular interest, such as their national territory or overseas regions, for a forecast with a shorter lead-time and on a more detailed computing grid. In Météo-France, the global configuration is called ARPEGE (Pailleux et al. 2015), and the regional configuration is called AROME (Bouttier, 2007).

There is a growing trend to replace the deterministic forecast (a single forecast made from the best possible initial state) with the probabilistic forecast (several simultaneous forecasts made from slightly different initial states to account for residual uncertainties in the initial state). This is called the Ensemble Forecast (see The Ensemble Forecasting). From these different forecasts, we can calculate the probability that certain feared or expected events will occur.

Finally, atmospheric parameter forecasts are used to force “impact models” that more accurately calculate sea state, river flows, snowpack conditions and avalanche risks, air quality, road conditions, etc..

Other forecasting systems are also used to better cover very short or very long deadlines: Immediate forecasting systems extrapolate observations up to a few hours, with very frequent refreshing and are more efficient than NWP models for these short deadlines. Once per month, seasonal forecasting systems calculate the probable climatic anomalies in the next 3 to 6 months, with results of highly variable quality depending on geographical areas and seasons (see The seasonal forecast). Seasonal prediction models are very similar in design to the climate models used for IPCC reports [4].

The raw results of all forecasting systems are stored in databases as they are produced, and these databases are constantly queried by algorithms that feed the various applications where users find the finalized information they want (e.g. websites or mobile applications). For the most sensitive applications, particularly those related to the security of people and property, the databases are supervised by an expert forecaster. The latter examines the consistency of forecasts from several models, the most recent observations, and may decide to trigger weather warnings. In France, this applies in particular to the Vigilance Map procedure (see The role of the forecaster).

The last important function of a NWP centre is the a posteriori verification of forecasts. This is done by comparing forecasts with the most reliable observations, accumulating results over time long enough to create scores. NWP centres calculate a very large number of scores on a daily basis and exchange this information with each other. This makes it possible to know the average quality of forecasts, to verify that a new version of a forecasting system represents an improvement over the previous version, or to compare the performance of two NWP centres. It also makes it possible to verify that developments in observing systems improve the quality of the forecast (e. g. when an end-of-life satellite is replaced by a more recent generation satellite). Figure 1 is an example of such forecast scores.

As the quality of forecasts has now reached a high level, it is necessary to test any changes in forecasting systems over long periods of time (several months) to ensure that the forecasts are never degraded. In addition, the natural variability of atmospheric predictability, which is independent of the quality of forecasting systems, must also be taken into account. It is well established that some parameters are easier to predict in summer than in winter, or vice versa, but it is also clear that the atmosphere can behave very differently, and more or less predictably, over several successive winters (or summers). This slow variability is one of the most exciting aspects of atmospheric dynamics, which is still very poorly understood.

3. The quality of the forecasts

The quality of the numerical weather forecasts varies according to the parameter considered and the lead-time (see table). At short notice the temperature is generally predicted with an error not exceeding a few degrees, and the wind with an error not exceeding a few metres per second, except in stormy areas. For rainfall, especially thunderstorms, this level of quality is not reached, as small errors on previous quantities result in larger errors on rainfall.

Precisely predicting the precise location of a storm and the amount of rainfall associated with it or the risk of hail remains extremely difficult, even a few hours in advance. The same is true for the amount of snow in winter, especially when the temperature is close to 0°C on the ground, and a small temperature error can lead to an error in the nature of precipitation (rain or snow). This is also the case for fog, which remains very difficult to predict, even a few hours in advance, because its formation depends on the humidity, which is very variable. For tornadoes, only a risk of occurrence should be indicated.

Encyclopédie environnement - prévision météorologique - prévision canicule juillet 2015 - forecast
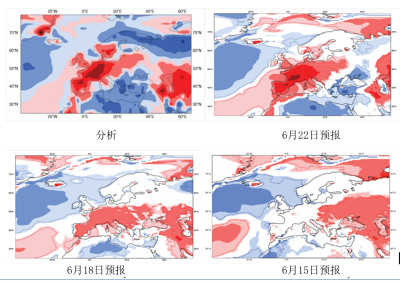
Figure 3. Forecast of the heat wave at the beginning of July 2015 using the ECMWF model. This major event was observed between 29 June and 7 July, with temperature records broken in several European countries. The figures show the average temperature anomaly over the week in question (+10°C for dark red), as observed (Analysis), and predicted on June 22, June 18, and June 15. It can be seen that the first forecast giving a relevant indication was issued 11 days before the start of the event (June 18). [Source: © ECMWF]
On the other hand, the forecasting of severe winter storms such as Xynthia (night of 27-28 February 2010) has made great progress, the risk can now be indicated 72 to 120 hours in advance, and on the basis of very accurate forecasts made 24 to 48 hours in advance, public authorities can take the necessary measures to protect people and property (closure of certain traffic routes, cancellation of outdoor events, etc.). The same applies to the beginning and end of cold waves or heat waves, which are now planned several days in advance, with very correct reliability (Figure 3).

Figure 4. State of the art of intense rainfall forecasting in the Mediterranean arc (so-called “Cévennes” episodes): on October 6, 2014, 260mm were recorded in 6 hours in Prades-le-Lèz in Hérault. On the left, forecast of rain accumulation between 18hTU and 24hTU by the AROME model of Météo-France (from the initial state of 00hTU) compared on the right to the cumulations observed by weather radars and rain gauges for the same time slot. The forecast was sufficiently relevant for “orange – flood and rain” vigilance to be declared (appropriately) for the departments of Hérault and Gard, however the model underestimated the maximum rain intensity, and gave a position slightly shifted to the northeast of the maximum rainfall. [Source: © Météo-France]
Floods are quite predictable in slow-dynamic river basins, where floods develop in several hours, but almost unpredictable in small basins with rapid dynamics, which can react in a few tens of minutes to heavy storm rain (for example the disaster of 3 October 2015 in Cannes). Improving the forecasting of flash flood risks in the Mediterranean regions is therefore one of the most important objectives of Météo-France (see Goulet, 2015 and Figure 4). This will probably require the development of ensemble forecasts to characterize the probability that precipitation will exceed certain critical thresholds in the following hours.

The quality of the forecasts with monthly to seasonal lead-times is still very modest. In tropical regions, some phenomena such as El Niño [5] are predictable several months in advance. On the other hand, in Europe, it is still impossible to predict the temperature more than a few weeks in advance.

4. The computing power

Encyclopédie environnement - prévision météorologique Evolution de la puissance calcul centre PNT
Figure 5. Evolution of the computing power of a NWP centre (FLOP stands for Floating Operations per Second, the most common unit for measuring the power of a computer). [Source: © Météo-France]
The computing power available in NWP centres must be considerable to produce quality forecasts in a timely manner (Figure 5). A constant question is to ensure optimal use of this computing power. The time at which a new forecast must be distributed to users is imposed by social habits, so it is necessary to organize the production process to respect this time (for example 6h/16h every day for the vigilance of Météo-France). There are two contradictory requirements: use the most recent observations, which tend to delay the start of production as much as possible, and use more precise, and therefore slower, models, which on the contrary require that this time be brought forward. We have to find the best possible compromise.

The degrees of freedom are numerous: the number of observations actually used, the complexity of the observation validation/assimilation algorithms, the resolution of the prediction models (i.e. the fineness of the computing grid), the complexity of the equations that can represent the processes in more or less detail, and the size of the prediction ensembles (generally the ensembles have several tens of members, but for some applications it could be advantageous to increase to several hundred). Finally, the distribution of computing power between atmospheric prediction and impact models requires careful consideration to ensure an optimal final result.

In the end, the start time of production varies according to the centres and products, from about ten minutes to several hours before the broadcast time.

5. R&D in anticipation

The improvement of NWP systems is based on the R&D departments of the NMS, which cooperate extensively with each other, but also with Universities and Research Organizations. There are still major knowledge challenges in the field of atmospheric processes and predictability, with obvious societal benefits that justify the public authorities devoting significant resources to this subject (in France, in university and CNRS laboratories in particular). The development of observation systems also leads to active technological research, with significant industrial benefits, particularly in the space sector, but also for ground-based radars and lidars [6].

Among the major R&D trends currently observed (2016), we can note in particular:

– The profound rewriting of codes to make the most of the new massively parallel computer architectures (problem of “scalability” [7]).
– The development of “coupled” prediction systems, in which one or more of the following modules are added to the atmospheric dynamics and physics model: underlying continental surface, ocean and wave dynamics, atmospheric composition (chemical species and especially aerosols). For this reason, NWP models increasingly resemble climate models, and most countries are seeking to share developments for NWP and climate.
– The development of ensemble predictions, which are now applied not only to the atmosphere, but also to other models (ocean and sea state, air quality, hydrology, snow cover, etc.)
– The accuracy and number of satellite observations are changing rapidly: the first direct wind measurements from Earth orbit are expected in 2017 (ESA’s ADM-AEOLUS Doppler lidar) and the first hyperspectral measurements in infrared from a geostationary satellite (3rd generation Meteosat IRS Instrument) are expected in 2020. Weather radar measurements are also becoming more efficient and varied.
– Indirect information on the state of the atmosphere from an increasingly diverse range of sources is gradually becoming available (so-called Big Data Paradigm [8]). For example, the trajectory of commercial aircraft is analyzed to estimate wind speed, wireless telecommunications disruptions provide information on rainfall, GPS networks provide information on air humidity, cars and mobile phones are now equipped with temperature and pressure sensors as standard. Capturing this new data and using it to improve forecasts will be one of the major challenges of the near future.
– In the United States and Europe, NMS are gradually moving towards the free distribution of raw NWP data over the Internet (see PSI Directive [9] in Europe).
– The private sector is also beginning to take an interest in the production of NWP, which is seen as an activity that can generate profits. Panasonic and IBM (The WeatherCompany [10]) recently communicated on this topic.

Table: Weather forecast deadlines


References and notes

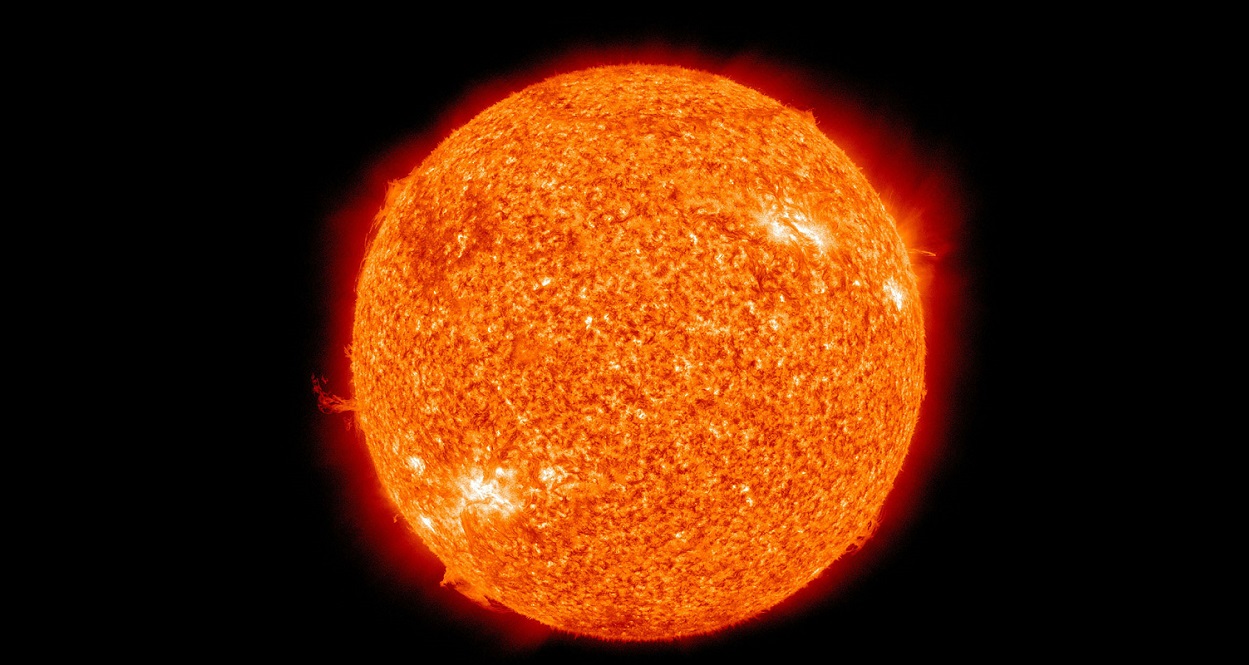
Cover image: As early as 1922, an English scientist, Lewis Fry Richardson, thought that it would one day be possible to calculate atmospheric flow fast enough to make forecasts. He imagined a calculation factory where hundreds of mathematicians would calculate the flow by hand, under the direction of a “conductor”! [© F. Schuiten, Météo-France]

[1] WMO is a United Nations family organization

[2] The European Centre for Medium-Range Weather Forecasting, located in Reading, UK (Woods, 2005).

[3] Meteorological radars make it possible to locate precipitation areas within a radius of about 80km by scanning the space in three dimensions at intervals of about two minutes.

[4] Intergovernmental Panel of Experts on Climate Change, set up by the UN.

[5] El Niño is the warming of the waters of the eastern tropical Pacific that occurs every 3 to 5 years around Christmas, with considerable impacts on regional activity.

[6] Meteorological lidars are instruments that emit a laser beam and measure the light backscattered by the atmosphere, based on the radar model; they make it possible to determine approximately the air speed and aerosol content in a volume of several kilometres around the instrument.

[7] The scalability of a code is its ability to efficiently exploit computers composed of a very large number of processors, computing in parallel. The most efficient weather codes distribute the calculations over tens of thousands of processors without loss of efficiency.

[8] Big Data is the set of methods and tools that extract useful information from the massive data flows that circulate on the Internet.

[9] Public Sector Information, a directive that requires public services to make their data freely accessible to citizens, unless there are justified exceptions.

[10] The WeatherCompany, based in the USA, is the world’s largest private meteorological company. Since the beginning of 2016, it has been part of the IBM group.


The Encyclopedia of the Environment by the Association des Encyclopédies de l'Environnement et de l'Énergie (www.a3e.fr), contractually linked to the University of Grenoble Alpes and Grenoble INP, and sponsored by the French Academy of Sciences.

To cite this article: BOUGEAULT Philippe (March 6, 2024), Introduction to weather forecasting, Encyclopedia of the Environment, Accessed December 3, 2024 [online ISSN 2555-0950] url : https://www.encyclopedie-environnement.org/en/air-en/introduction-weather-forecasting/.

The articles in the Encyclopedia of the Environment are made available under the terms of the Creative Commons BY-NC-SA license, which authorizes reproduction subject to: citing the source, not making commercial use of them, sharing identical initial conditions, reproducing at each reuse or distribution the mention of this Creative Commons BY-NC-SA license.

天气预报介绍

PDF
Encyclopédie environnement - prévision météorologique - couverture

  下周末有什么样的天气?未来几天出现暴风雨、雷暴和热浪的风险有多大?气象服务现在能够有效地回答这些问题。但是这些预报的背后是什么机制?本文概述了世界上许多国家的数值天气预报中心的功能,并介绍了本板块其他文章中提及的一些重要概念。

1. 介绍
环境百科全书-天气预报-ARPEGE模型
图 1. ARPEGE 模型在过去15年的预报质量变化。得分表示 500hPa 位势高度(位势是 500hPa 压力面的精确海拔高度,大约是 5000m)预报值的均方根误差,是整个北半球20°N 以北的平均值,起报时间为提前24,48,72,96小时。预报质量的平稳的提升,使得11到12年之间的24小时预报精度得到了提高。[来源:法国气象局]

  天气预报质量的显著提高是20世纪环境科学的伟大成功之一,并且在21世纪初期继续以稳定的速度发展(见图1和Bauer等,2015)。这是由于数值预报系统的进步以及对大气和相关介质状态(海洋,土壤,植被,冰冻圈)观测的数量种类的增加,包括地球观测卫星的观测。超级计算机的快速发展是成功的关键因素之一,而计算机的发展需要科学工作的支撑。

  世界上的每个国家都有一个国家气象局,其任务是定期对大气进行监测,并且为政府、工业界和公众发布预报。但只有最发达的国家才有数值天气预报(NWP)中心,在世界气象组织[1]的框架内,这些中心的产品也会分发给其他国家,以换取他国的观测数据。

  在欧洲之外的主要NWP中心分布在美国、加拿大、日本、韩国、中国、俄罗斯、澳大利亚、印度、摩洛哥、南非和巴西。在欧洲仅有法国、英国和德国会做全球尺度的数值预报,其他有NWP中心的国家仅仅进行区域性预报。欧洲国家也合作开展了一个“超级中心”[2]为他们提供中期数值预报。

2. NWP中心的不同功能
环境百科全书-天气预报-观测系统
图2. 观测系统在飞行气象学中的应用。[来源:WMO/法国气象局]

  NWP中心的组织结构因国家而异,但有以下所述的一些共同的主要职能。第一个重要职能接收观测结果。观测结果是指描述大气或有关介质状态的所有数值数据。这些观测结果各不相同(见图2),我们将特别关注以下几项结果:

  • 来自世界各地的气象部门在陆地或离岸浮标上进行的地表测量;
  • 用探空气球(无线电高空测候器)或气象雷达测量的海拔[3]
  • 由气象卫星,或者更笼统地称为地球观测卫星(目前有15颗此类卫星)进行的测量;
  • 在商用飞机或船舶上进行的测量。

  这个综合观测系统花费了气象预报的大部分成本,这个成本由世界上所有国家共同承担。不同国家之间免费交换观测资料(有时在战时也不例外)这是气象学最引人注目的成就之一。

  这些数据的量相当庞大(每天全球各地有数千万次观测),但是科学家们会全力确保它们能够尽快地到达NWP中心,通常情况下在观测后三小时之内就能送达。当获得观测数据时,这些中心必须有强力的远程通信和信息处理系统来接收、处理和存储它们。

  第二个功能是对观测结果进行严格检查,以识别可能的错误(测量系统是否出现故障),冗余或偏移的观测结果。这通常是通过比较相邻的观测值,或比较每一个观测值与同一参数的最近预报值来实现(如果观测值与预报值差别很大,则可能被视为可疑结果,除非它能够被邻近的独立观测值证实)。在观测结果中发现的任何异常都会被上报至初始部门,之后由他们进行纠错。

  第三个功能是根据多变的、异质性的一系列近期观测结果,以数学场的形式创造一个大气的“状态”,用来启动预测模型。产生预报初始状态的任务被称为数据同化(见气象资料同化)。我们的原始目标是在指定时刻制造一个尽可能接近现实的初始状态,但这是非常困难的,因为观测会受到一些微小不确定性的影响,观测与影响因素不同步且观测点并没有覆盖地球上的所有点位。因此,有必要在时空尺度上进行插值,并在考虑所有可用信息的情况下搜索“最可能”的初始状态。

  第四个功能预报本身,由大气的数值模式完成(见天气预报模式)。该模式求解了流体力学方程并对大气连续状态进行计算,从而对 24h、48h 等时间点的大气状态进行预报。大部分 NWP 中心实际会使用多种预报模型的配置:能提前几天预测的全球适用版本;涵盖特定关注地区的一个或多个“区域”的版本,如国家领土或海外地区,这类预报提前期较短,栅格更精细。在法国气象局中,全球尺度的配置被称为 ARPEGE(Pailleux et al. 2015),区域性的配置被称为 AROME(Bouttier,2007)。

  现在有一种趋势是用概率性预报(从多个略微不同的初始状态进行预报来解释初始状态中的剩余不确定性)取代确定性预报(从最可能的初始状态进行的单一预报)。这被称为集成预报(见集成预报)。根据这些不同的预报,我们可以计算出一些令人或担忧或期望的事件发生的概率。

  最后,大气参数预报被用于驱动“影响模型”,以更准确地计算海洋状态、河流流量、积雪条件、雪崩风险、空气质量和道路条件等。

  其它预报系统也用于截止时间较短或较长的不同预报情景:及时预报系统将观测数据外推到数小时内,并经常刷新,短期时间段内它比 NWP 模型更有效。季节预报系统每月计算一次未来3至6个月内可能出现的气候异常,参差不齐的预报质量因地理区域和季节而异(见季节预测)。季节预测模型在设计上与IPCC报告中使用的气候模型非常相似[4]

  所有预报系统的原始结果在生成时都被存储在数据库中,这些数据库不断被算法查询,算法为各种应用程序提供数据,用户可以在应用程序(如网站或手机应用)中找到他们需要的最终信息。对于最敏感的应用情景,特别涉及到人员和财产安全的事件,数据库会由一位专家预报员监督,检查几个模型的预报一致性,以及最近时间的观测结果,并决定是否触发天气预警。在法国,这主要应用于警戒地图中(见预报员的作用)。

  NWP 中心的最后一个重要功能是对预报的后验验证。中心可以将预报结果与长期积累的最可靠的观测结果进行对比,并得出分数。NWP 中心每天计算大量的分数,并相互交换这些信息。使我们能够了解预报的平均质量,验证新版本的预报系统是否比前一版本有所改进,或者比较两个 NWP 中心的表现。也可以研究观测系统的发展是否能够提高预报的质量(例如,当报废的卫星被更新一代的卫星取代时)。图1是此类预报分数的示例。

  由于预报质量现在已达到了一个较高的水平,因此有必要在较长时间段(几个月)内监测预报系统的变化,以确保预报精度不会降低。此外,还必须考虑不依赖于预报系统质量的大气可预测性自然变率。众所周知,一些参数在夏季比冬季更容易预报,反之亦然。但是同样明确的是大气的行为变化很大,在几个连续的冬天(或夏天)可以更容易或更难预报。这种缓变的变率是大气动力学中最令人兴奋的方面之一,但人们依旧对它知之甚少。

3. 预报的质量

  数值天气预报的质量随着考虑的参数和预报提前时间而变化(见表格)。在短时间内,通常预报温度的误差不会超过几度。除暴风地区外,预报风速的误差不会超过每秒几米。对于降雨,尤其是雷雨天气的预报质量就不会达到这种水平,因为前期数量上的微小误差会导致对降雨预报的较大误差。

  即使是提前几个小时,仍然很难准确预报风暴的精确位置和与之相关的降雨量或冰雹的风险。冬季降雪量也是如此,特别是当地面温度接近 0°C 时,细微的温度误差可能导致降水性质(下雨或是下雪)不同。雾也是如此,即使只是提前几个小时也很难预报,因为它的形成取决于变化很大的湿度。至于龙卷风,只需要指出其出现的风险。
环境百科全书-天气预报-ECMWF模型预报
图3. 使用 ECMWF 模型对2015年7月初热浪的预报。这一重大事件生在6月29日至7月7日被观测到,几个欧洲国家的气温记录被打破。图片显示了一周内在6月22日、6月18日和6月15日的平均温度异常(暗红色为+10°C)的观测(分析)值和预报值。可以看出首次给出相关指示的预报是在事件开始前11天(6月18日)发布的。[来源:© ECMWF]

  另一方面,对例如Xynthia(2010年2月27-28日晚)等严重冬季风暴的预报取得了很大进步,现在我们可以基于24到48小时的准确预报,提前72到120小时发出风险预警。政府也能够采取必要的措施去保护人民和财产安全(关闭某些交通路线、取消户外活动等)。同样,现在我们还能提前几天预报寒潮或热浪的开始和结束,并制定应对计划,且预测结果非常可靠(图3)。
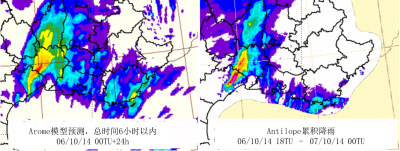
环境百科全书-天气预报-地中海弧区域强降雨预报
图4. 地中海弧区域强降雨预报的最新进展(所谓的“塞文山脉”事件):2014年10月6日,在埃罗的普拉德斯-莱兹,记录到了6小时内260mm降雨。左边是法国气象AROME模型(从00hTU的初始状态)预报的18hTU和24hTU之间的累积降雨量,右边是天气雷达和雨量计在同一时间段观测到的累积降雨量。预报与埃罗和加德相关部门发布的“橙色洪水和降雨”预警具有很强的相似性,但是这个模型低估了最大降雨强度,且给出的最大降雨的位置也稍向东北偏移了一点。[来源:法国气象局]
  在动态变化缓慢的流域中,通常只需要几个小时就可以形成洪水,但这种情况是完全能够预报的,但是在动态变化迅速的小流域中洪水几乎是不可被预报的,其在几十分钟内就可能对暴雨形成呼应(例如2015年12月3日的戛纳洪灾)。因此,提高对地中海地区暴洪风险的预报能力是法国气象局最重要的目标之一(见Goulet,2015和图4)。这很可能需要开发集成预报来表征接下来几个小时内降水量超过某些临界阈值的概率。

  月到季节尺度的预报质量仍然是不高。虽然在热带地区我们可以提前几个月预报厄尔尼诺[5]等现象,但在欧洲仍然不太可能提前几周预报气温。

4. 计算能力
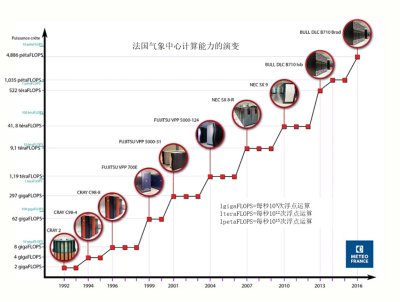
环境百科全书-天气预报-NWP中心计算能力的演变
图5. NWP中心计算能力的演变(FLOP代表每秒的浮点运算量,这是衡量计算机能力的最常用单位)。[来源:法国气象局]
  数值预报中心能够使用的算力必须足够大,才能及时生成高质量的预报(图5)。一个永恒的问题是确保算力能够得到最佳的利用。向用户发布最新预报的时间是由社会习惯决定的,因此有必要协调组织生产过程以遵循这一时间(例如法国气象局会在每天在6h/16h进行预警)。这时有两个互相矛盾的需求:如果使用最新的观测结果,就会延迟预报的初始环节;如果使用更精确同时也因此速度较慢的模型,则需要我们提前初始时间。我们必须找到最好的折衷方案。

  预测的自由度体现在很多方面:实际使用的观测数量、观测验证/同化算法的复杂性、预报模型的分辨率(即计算格栅的精细度)、复杂的方程在模拟过程中对于细节的还原程度有多大、集成预报的规模(通常集合中有几十个模型,但在某些应用场景下可能需要增加到几百个)。最后,算力在大气预报模型和影响模型之间的分配也需要慎重考虑,以确保最佳的预报结果。

  最终,预报的开始时间根据机构中心和产品的不同也有所不同,大约在播出时间前十分钟到几小时不等。

5. 研发展望

  NWP系统的改进基于其研发部门,这些部门不仅彼此合作,还与大学和研究机构广泛合作。在大气过程和可预报性领域仍然存在严峻挑战,且具有明显的社会效益,公共部门应该为这一学科投入大量资源(在法国,尤其是在大学和CNRS实验室)。观测系统的发展还对技术研究起到了积极的引导作用,具有重大的工业效益,特别是在航天部门,同时也有利于地基雷达和激光雷达的研发[6]

  在目前观察到的主要研发趋势(2016)中,以下几个方面值得特别注意:

  -对代码的内在改写,以充分利用新的大规模并行计算机结构(“可扩展性”的问题[7])。

  -开发“耦合”预报系统,将以下一个或多个模块添加到大气动力学和物理学模型中:下伏陆表、海洋与波浪动力学、大气成分(化学组分,尤其是气溶胶)。因此,NWP模型越来越类似于气候模型,大多数国家都在追求共享NWP和气候学的发展。

  -集成预报的发展现在不仅应用于大气,还应用于其他模型中(海洋和海况、空气质量、水文、积雪等)。

  -卫星观测的精度和数量正在迅速变化:预计2017年将第一次在地球轨道实现对风的直接测量(ESA的ADM-AEOLUS多普勒激光雷达),预计2020年将进行第一次地球同步卫星红外高光谱测量(第三代MeteosatIRS仪器)。气象雷达测量也变得更加有效和多样化。

  -来源日益多样化的与大气状态相关的间接信息正在逐渐变得容易获得(也叫做大数据范式[8])。例如,分析商用飞机的轨迹来估算风速,无线通信的中断能提供降雨信息,GPS网络提供空气湿度信息,汽车和手机现在按标准需要装备温度和压力传感器。获取这些新数据并利用它们改进预报将是近期的主要挑战之一。

  -在美国和欧洲,NMS正逐步实现通过互联网免费分发原始NWP数据(见欧洲PSI局[9])。

  -私营单位也开始对NWP的产品产生兴趣,认为它们能够创造利润。松下和IBM(气象公司[10])最近就这个话题进行了沟通。

表格:天气预报截止时间


参考资料及说明

封面图片:早在1922年,英国科学家刘易斯·弗莱·理查森(LewisFryRichardson)就认为有一天能够足够快地计算出大气流量并做出预测。他设想了一个计算工厂,数百名数学家将在一个“指挥家”的指导下手动计算流量![F.Schuiten,法国气象局(Météo-France)]

[1] WMO是联合国组织中的一员。

[2] 欧洲中期天气预报中心,位于英国雷丁(Woods,2005)。

[3] 气象雷达以两分钟左右的时间间隔进行三维空间扫描,使得降雨地点被定位在以80km为半径的区域成为可能。

[4] 联合国成立的政府间气候变化专家小组。

[5] 厄尔尼诺现象是每隔3至5年,在圣诞节前后发生的热带太平洋东部水域变暖现象,其会对区域活动产生重大影响。

[6] 气象激光雷达是基于雷达模型发射激光束并测量光波被大气后向散射的仪器;其使我们能够大致确定仪器周围几公里范围内的空气速度和气溶胶含量。

[7] 代码的可拓展性是它能够有效开发由大量处理器组成的计算机并行计算的能力。最高效的气象代码能够将计算分配给数万个处理器且不损失效率。

[8] 大数据是一套从互联网中传播的海量数据流中提取有用信息的方法和工具。

[9] 公共信息部门,是要求公共服务机构除有认证的例外情况外,须向公民免费提供数据的指令。

[10] 总部设在美国的气象公司(WeatherCompany)是世界上最大的私营气象公司。自2016年初以来,它一直是IBM集团的一部分。


The Encyclopedia of the Environment by the Association des Encyclopédies de l'Environnement et de l'Énergie (www.a3e.fr), contractually linked to the University of Grenoble Alpes and Grenoble INP, and sponsored by the French Academy of Sciences.

To cite this article: BOUGEAULT Philippe (March 12, 2024), 天气预报介绍, Encyclopedia of the Environment, Accessed December 3, 2024 [online ISSN 2555-0950] url : https://www.encyclopedie-environnement.org/zh/air-zh/introduction-weather-forecasting/.

The articles in the Encyclopedia of the Environment are made available under the terms of the Creative Commons BY-NC-SA license, which authorizes reproduction subject to: citing the source, not making commercial use of them, sharing identical initial conditions, reproducing at each reuse or distribution the mention of this Creative Commons BY-NC-SA license.